
A Whirlwind Week Leaves US Assets Reeling Amid Tariff Turmoil
It has been a brutally volatile week across global markets, driven by a whirlwind of US tariff implementations, abrupt reversals, and rapid retaliatons. Investors were left scrambling to make sense of the White House’s constantly shifting trade stance. We won’t attempt to recap every step of the tariff saga, when even members of the administration seemed unable to track the unfolding policy moves.
The most consequential outcome of the week was the broad-based pressure on US assets. The sharp selloff in Treasuries drew the most concern, raising alarms over whether the bedrock of the financial markets is beginning to erode. That said, while the jump in yields was certainly eye-catching, it has yet to cross the threshold into full-blown crisis territory.
US stocks, after plunging to their lowest levels in months mid-week, managed to stage a strong rebound. Key technical support levels held, keeping the long-term uptrend intact—for now. However, that doesn’t mean the risks are gone. If the mounting tariffs ultimately tip the US into recession, the bounce may prove to be nothing more than a bear market rally.
Dollar also struggled, ending as the week’s worst performer. Despite rising yields and some risk-off mood, neither provided the greenback any meaningful support. Dollar Index is now on the verge of resuming its broader medium-term downtrend.
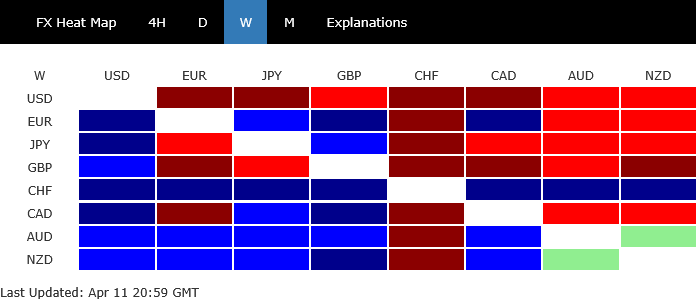
In the broader forex markets, Sterling and Yen also underperformed. On the other end, Swiss Franc stood tall as the market’s safe-haven anchor, followed by Australian and New Zealand Dollars. Euro and Canadian Dollar ended the week in middle ground.
Tariff Shock and Yield Spike Rattle Markets; Not a Crisis Yet, But Warnings Are Flashing
The essence of the market chaos: US reciprocal tariffs officially went into effect—only to be paused within hours to allow room for negotiation, except for China. On the surface, that might have calmed markets. And indeed, it opened the door to dialogue, with Taiwan reportedly holding the first video talks, while delegations from the EU and Japan are en route for face-to-face meetings in Washington in the coming days.
But on the other side of the equation was deepening hostilities between the US and China. Both sides escalated tariffs beyond economically meaningful levels, effectively moving toward full-scale trade decoupling. The narrative is no longer about negotiation—it’s about economic separation.
What spooked markets the most wasn’t just the trade conflict, but the simultaneous selloff in US assets—equities, Dollar, and perhaps most importantly, Treasuries. This rare alignment of outflows suggested something deeper: a loss of confidence. Some speculate this is precisely why US President Donald Trump reversed course and paused the reciprocal tariffs—because of the violent reaction in the bond market.
Indeed, Trump and his economic advisors have repeatedly cited the importance of keeping bond yields low to support the broader economic agenda. As yields spiked and refinancing costs soared, concerns within the White House likely escalated. A persistent rise in yields would undermine everything from fiscal stimulus to housing affordability and corporate balance sheets.
There are several theories about what triggered the Treasury selloff. Some point to the unwinding of the “Treasury basis trade”—a leveraged strategy used by hedge funds that collapsed under margin stress. Others blame foreign governments, particularly China, for dumping US debt in retaliation.
But perhaps the most straightforward explanation is the simplest: long-term investors are losing interest in US assets, shifting instead into alternatives like Gold in this time of uncertainty, which surged to fresh record highs this week.
Importantly, not all global bond markets are suffering. Germany’s 10-year yield remained within a calm 2.5–2.7% range.
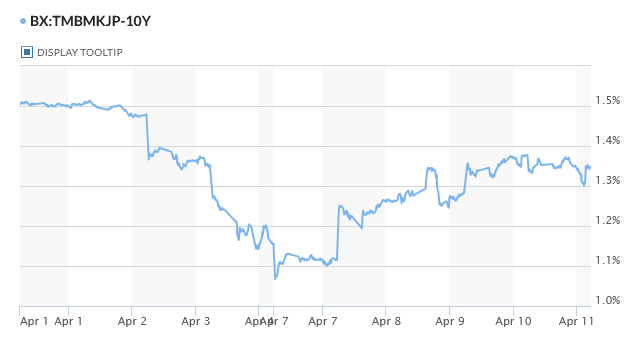
Japan’s 10-year yield held steady around 1.3–1.4% after being pulled up by US yields.
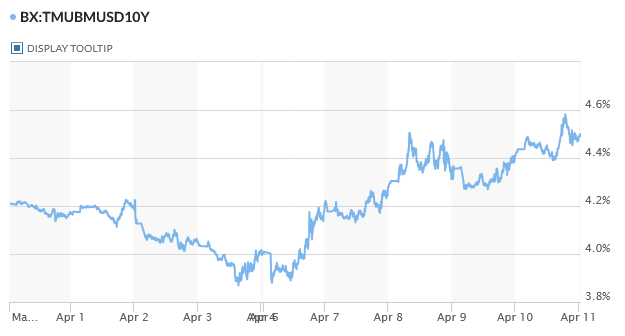
In contrast, US 10-year yields soared, nearing 4.6%, a stark rise from just 3.89% a week ago.
Technically, the picture in US 10-year yields is worrying but not yet in panic mode. For the near term, the decline from 4.809 should have bottomed at 3.886% as a correction. As long as 4.289 support holds, further rise toward 4.809 is expected.
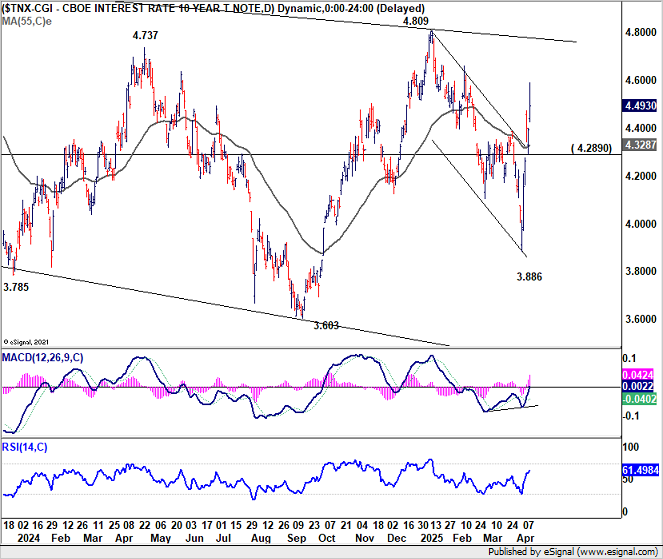
That said, this is still within the bounds of a broad consolidation pattern from the 2023 peak at 4.997%. Current rally might just be one of the legs.
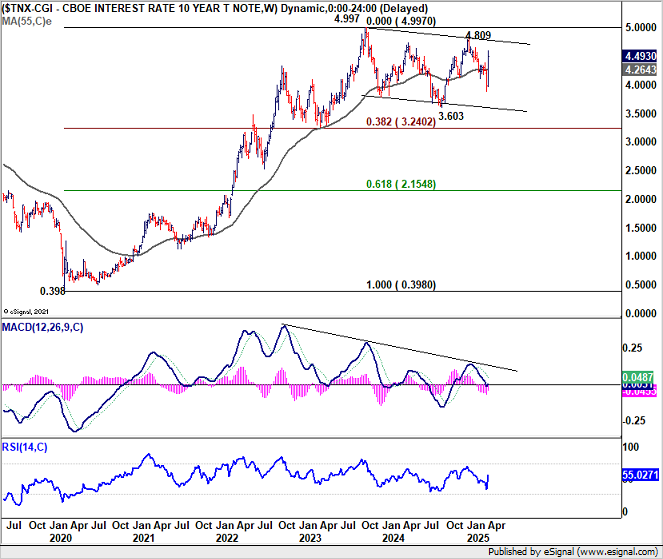
However, if 10-year Treasury yields were to break decisively above the symbolic 5% level, the impact could be seismic. Borrowing costs across the economy would surge along, from mortgages to corporate debt, tightening financial conditions at a pace that could choke off growth.
Beyond the US, such a move could trigger forced selling by foreign holders, particularly if trade tensions worsen or FX reserves are rebalanced. The result could be a broad and disorderly repricing of global assets, especially in equity markets and emerging economies, ushering in a new chapter where financial stability, rather than inflation, becomes the dominant concern.
Stock Rebound Preserves Uptrend, But Recession Could Break the Spell
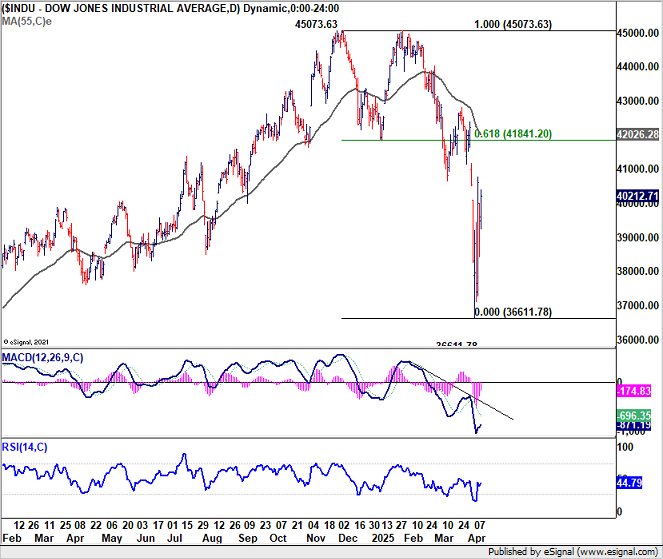
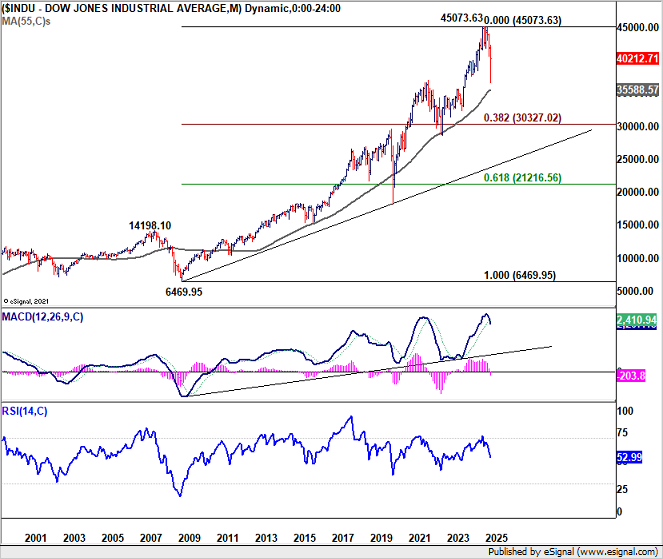
The steep intra-week selloff in US equities, among the sharpest in years, has been met with an equally aggressive rebound. Key technical levels held, for example in DOW, which bounced decisively ahead of the 55-month EMA, preserving the long-term uptrend from the 2009 low. For now, market action points to a deep medium-term correction rather than the beginning of a full-blown bear market. However, it would be premature to call the all-clear.
Many economists and central bankers globally have described the US tariff hikes as a textbook stagflationary shock—simultaneously dampening growth and fueling price pressures. According to estimates from the European Commission, the existing 10% blanket tariffs and the 25% metal duties could shave 0.8% to 1.4% off US GDP by 2027. For the EU, the impact is more muted at around 0.2%. But if the tariff regime becomes entrenched or if retaliations escalate further, those numbers could rise dramatically—especially with US-China tariffs not yet fully factored in.
Inflation expectations are also flashing warning signs. While the March US CPI data delivered some relief by slowing more than expected, the University of Michigan’s consumer survey painted a grimmer picture. One-year inflation expectations surged to 6.7%—a level last seen in 1981—up sharply from 5.0% in March. Inflation could reaccelerate ahead if supply shocks persist or if inflation expectations become unanchored.
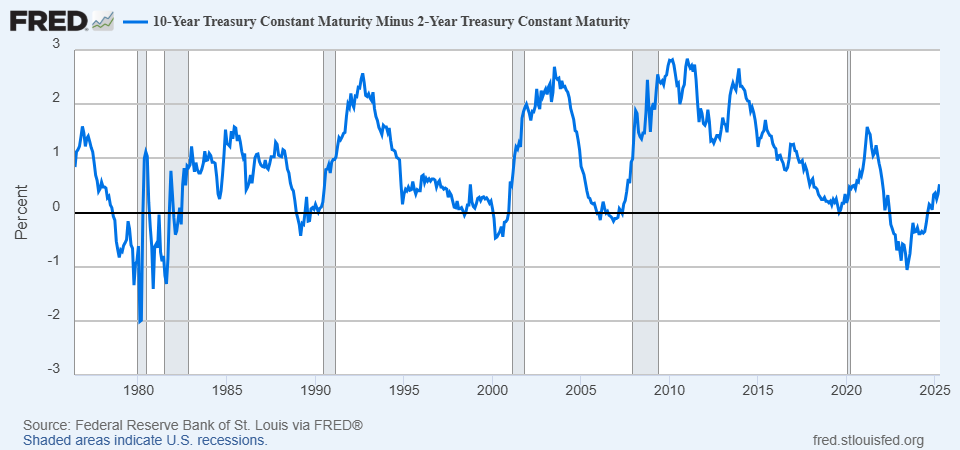
Adding to the concern is the historical warning from the yield curve, something that we have mentioned a number of times. The spread between the US 10-year and 2-year Treasuries—the classic recession signal—inverted in mid-2022 and uninverted last August. Historically, this un-inversion has preceded recessions around 6 to 12 months. That puts the timeline for a economic downturn squarely within 2025. That clock is ticking.
Technically, DOW’s defense of 55 M EMA (now at 3558.57) keeps long-term uptrend from 6369.96 (2009 low) alive. For the near term tough, firm break of 61.8% retracement of 45703.63 to 36611.78 at 41841.20 is needed to confirm that correction from 45703.63 has completed. Without that, the best investors can expect is range-bound consolidation.
The worst-case scenario? Decisive break of 55 M EMA would open up deeper fall to 38.2% retracement of 6469.95 to 45703.64 at 30327.02 at least.
Dollar Index Cracks 100 Psychological Level, Heading to 95?
Dollar Index dived to as low as 99.01 last week as fall from 110.17 reaccelerated. The break of 100.15 support (2024 low) affirms the case that whole down trend from 114.77 (2022 high) is resuming. Further break of 99.57 (2023 low) should confirm this bearish case. Meanwhile, near term risk will stay heavily on the downside as long as 103.22 support turned resistance holds, even in case of recovery.
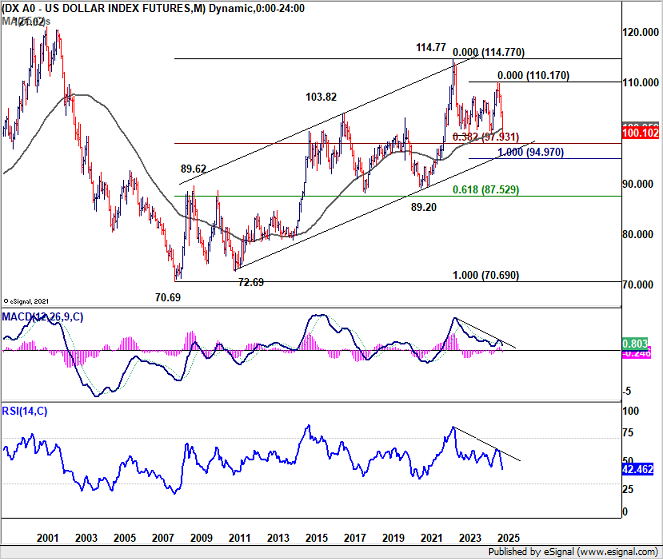
So where will Dollar Index head to? Price actions from 114.77 are so far still viewed as a corrective pattern. The next line of defense could come at 38.2% retracement of 70.69 (2008 low) to 114.77 at 97.93. If not, the next target will be 100% projection of 114.77 to 99.57 from 110.17 at 94.97.
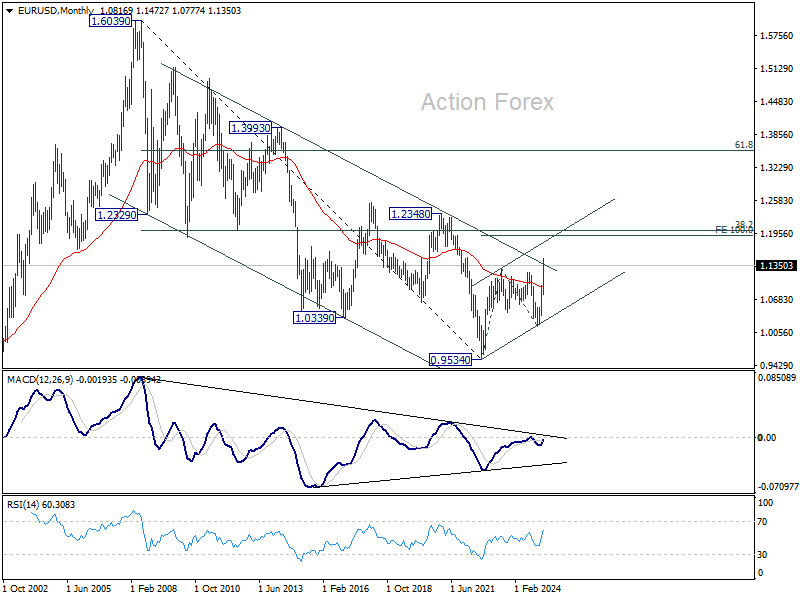
The development in EUR/USD should also be considered. Last week’s break of 1.1274 resistance (2023 high) should confirm resumption of whole rise from 0.9534 (2022 low). More importantly, EUR/USD is now breaking through the falling channel resistance that lasted more than 1.5 decade. Rise from 0.9534 is likely to extend to 100% projection of 0.9534 to 1.1274 from 1.0176 at 1.1916, or slightly further to 38.2% retracement of 1.6039 (2008 high) to 0.9534 at 1.2019.
Given the EUR/USD’s bullish outlook, and that Yen is also strong against Dollar, Dollar index is more likely to hit above mentioned 94.97 projection level than not.
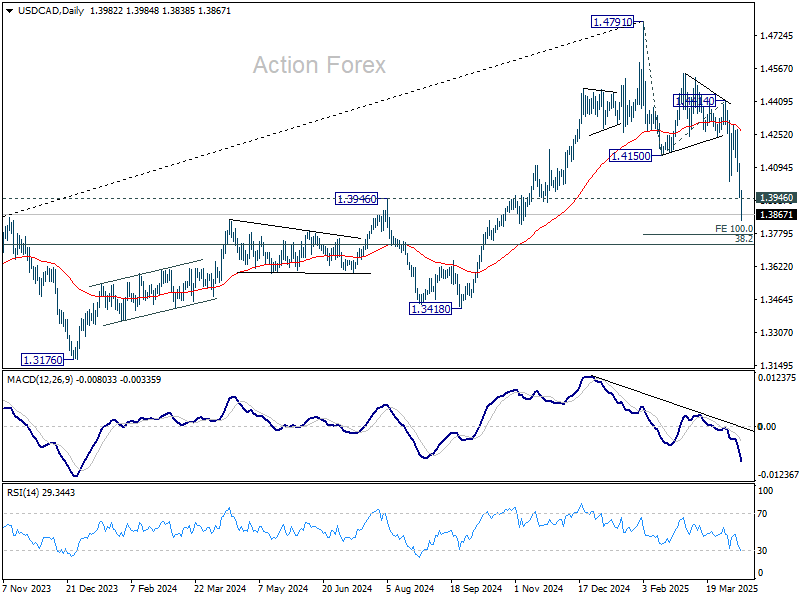
USD/CAD’s fall from 1.4791 high continued last week and accelerated through 1.3946/76 key support zone. There is no sign of bottoming yet. Initial bias stays on the downside this week for 100% projection of 1.4791 to 1.4150 from 1.4414 at 1.3773. On the upside, break of 1.4150 support turned resistance is needed to indicate short term bottoming. Otherwise, outlook will stay bearish in case of recovery.
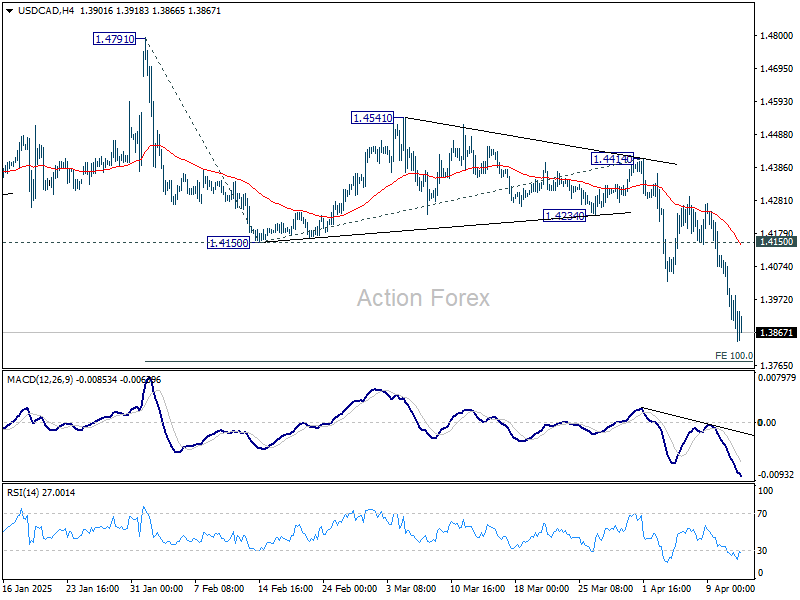
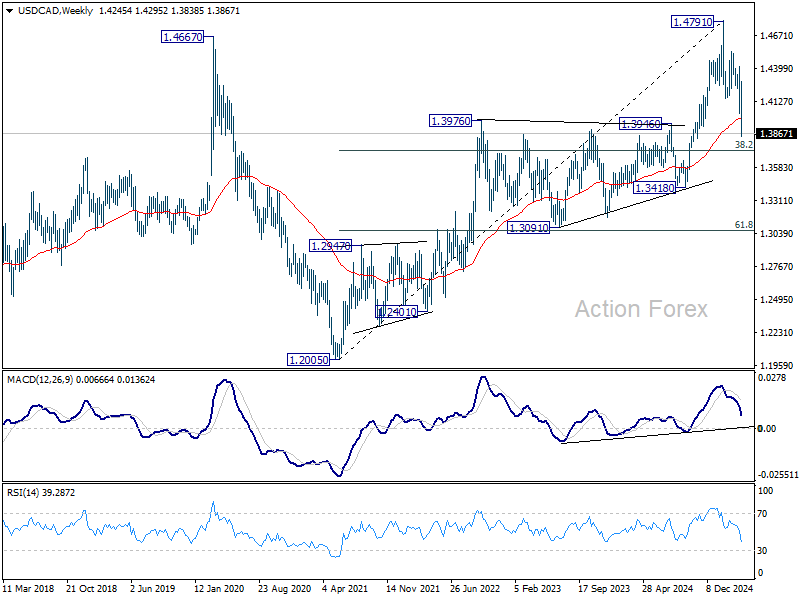
In the bigger picture, the break of 1.3976 resistance turned support (2022 high) and 55 W EMA (now at 1.3992) indicates that a medium term is already in place at 1.4791. Fall from there would either be a correction to rise from 1.2005, or trend reversal. In either case, firm break of 38.2% retracement of 1.2005 (2021 low) to 1.4791 at 1.3727 will pave the way back to 61.8% retracement at 1.3069.
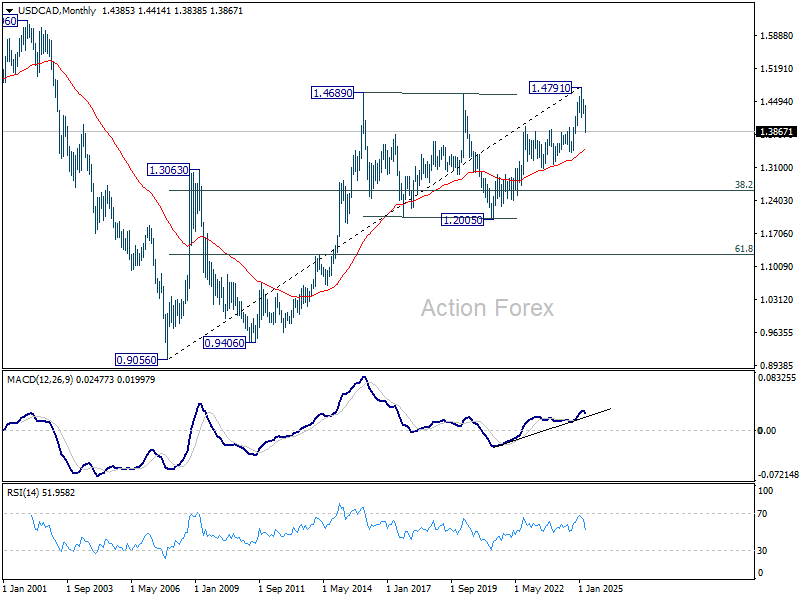
In the long term picture, as long as 55 M EMA (now at 1.3479) holds, up trend from 0.9056 (2007 low) should still resume through 1.4791 at a later stage. However, sustained trading below 55 M EMA will argue that the up trend has already completed, with rise from 1.2005 to 1.4791 as the fifth wave. 1.4791 would then be seen as a long term top and deeper medium term correction should then follow.
Gyrostat Capital Management: Why Risk Management Is Not About Predicting Risk
Why Risk Management is Not About Predicting Risk Financial markets reward confidence, but they punish certai... Read more
Gyrostat January Outlook: Calm At Multiyear Extremes
This monthly Gyrostat Risk-Managed Market Outlook does not attempt to forecast market direction. Its p... Read more
Gyrostat December Outlook: The Market Does The Work
Harnessing Natural Volatility for Consistent Returns Markets have always moved more th... Read more
Gyrostat Capital Management: Why Advisers Must Scenario-Plan Both The Bubble And The Bust
The Blind Spot: Why Advisers Must Scenario-Plan Both The Bubble and The Bust In financial m... Read more
Gyrostat Capital Management: The Hidden Architecture Of Consequences
When Structures Themselves Become A Risk In portfolio construction, risk is rarely where we look for it.... Read more
Gyrostat November Outlook: The Rising Cost Of Doing Nothing
Through the second half of 2025, markets have delivered a curious mix of surface tranquillity and instabi... Read more