Bitcoin Bounces To $84k: Is Following The Crowd A Losing Strategy?

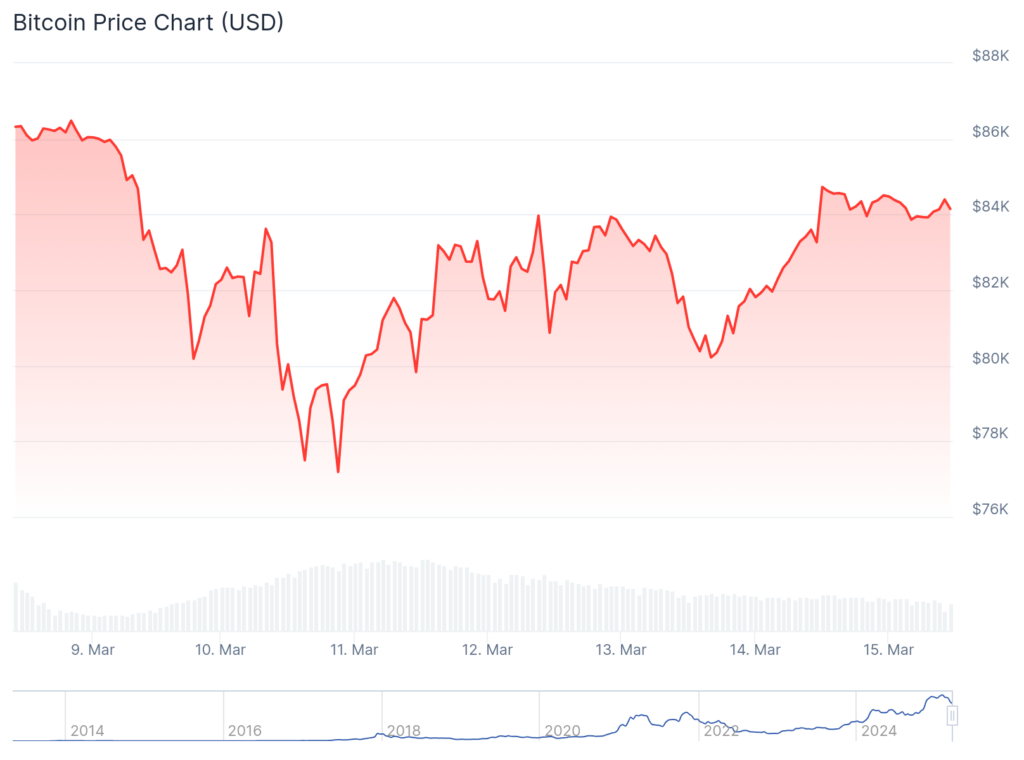
Bitcoin’s recovery to $84,500 on Friday exemplifies why following crowd sentiment often leads to poor trading decisions.
The recent market movements contradict common predictions during periods of extreme fear or greed.
Data analysis from Santiment reveals that social media reached peak negativity when Bitcoin (BTC) dipped to $78,000 earlier in the week. There was also online chatter about further declines. This pattern mirrors late February’s market behavior when a temporary price surge in early March followed retail traders’ bearish outlook.
https://twitter.com/santimentfeed/status/1900700480034271434
“Bitcoin’s rally back to $84.5K Friday shows what happens when the Monday crowd claims it’s time to sell,” Santiment noted. “Predictably, FUD hit its peak as $BTC was down to $78K, with predictions pouring in for lower prices all across social media.”
The research highlights Bitcoin’s recent stability within a defined range, having neither fallen below $70,000 nor broken above $100,000 over the past month. This stability creates clear sentiment markers: predictions below $70,000 means excessive fear, while forecasts above $100,000 signal overexuberance.
“Historically, markets move the opposite direction of the crowd’s expectations,” Santiment explained. They noted that clusters of bearish predictions ($10K-$69K) often follow upward reversals, while groupings of bullish forecasts ($100K-$159K) usually signal downturns.
Technical analysis supports this sentiment-based approach. Crypto analyst Rekt Capital pointed out that “the signs for a weakening resistance were there.”
He noted that the recent price movement is filling the CME gap between $82,245 and approximately $87,000. He suggests that a daily close above resistance could catalyze further upward momentum.
The current market structure also presents potentially bullish technical signals. Another analyst, Merlijn The Trader, highlighted Bitcoin’s approaching “golden cross.”
This is a technical pattern where the 50-day moving average crosses above the 200-day moving average.
This indicator has historically preceded substantial rallies:
- 139% in 2016
- 2,200% in 2017
- 1,190% in 2020 following previous occurrences.
When sentiment reaches extremes, positions become overcrowded on one side, creating the conditions for sharp reversals. As traders collectively lean bearish, selling pressure exhausts, leaving primarily buyers to influence price action.
At last check, Bitcoin was down 0.2% for the day, trading at $84,145. It’s down 22.7% from its all-time high of $108,786.

Crypto Firms Push Into US Banking
America’s cryptocurrency companies are scrambling to secure a foothold in the country’s traditional banking system, ... Read more
Ether Surges 16% Amid Speculation Of US ETF Approval
New York, USA – Ether, the second-largest cryptocurrency by market capitalization, experienced a significant surge of ... Read more
BlackRock And The Institutional Embrace Of Bitcoin
BlackRock’s strategic shift towards becoming the world’s largest Bitcoin fund marks a pivotal moment in the financia... Read more
Robinhood Faces Regulatory Scrutiny: SEC Threatens Lawsuit Over Crypto Business
Robinhood, the prominent retail brokerage platform, finds itself in the regulatory spotlight as the Securities and Excha... Read more
Ethereum Price Holds Five-year Range As Breakdown Risk Points To $950
The current Ethereum price is within a long-term five-year range and positioned below key volume levels, increasing the ... Read more
400 Million Coins Left: BlockDAGs $0.0005 Entry Price Is About To Vanish Forever
BlockDAG is entering its final presale hours at a fixed price of $0.0005, with only 400 million coins remaining before p... Read more

