USD, US Dollar Price Analysis
- It’s a holiday week in the US as Friday sees markets close in observance of Independence day; but before we got to that, there are multiple high-impact releases on the DailyFX Economic Calendar.
- The US Dollar has been range-bound for the past couple of weeks; but this comes just on the heels of a bearish trend driving into a key spot of support. Might the bigger picture bearish trend come back – or is this range simply setting up for a stronger counter-trend move?
US Dollar Range Remains in Final Week of Q2 Trade
It’s a short week in the United States but it’s a big one nonetheless. Not only do we have a rather pensive theme across equities, with very big questions marks as to whether the outsized bullish trend may have potential for more; but this week’s economic calendar is loaded with high-impact US items that will further help market participants get an idea for economic expectations in the months to come.
On top of that, this week also marks the finish the H1 and the open of both H2 and Q3; and this was a rambunctious first half of the year pretty much by any stretch of the phrase.
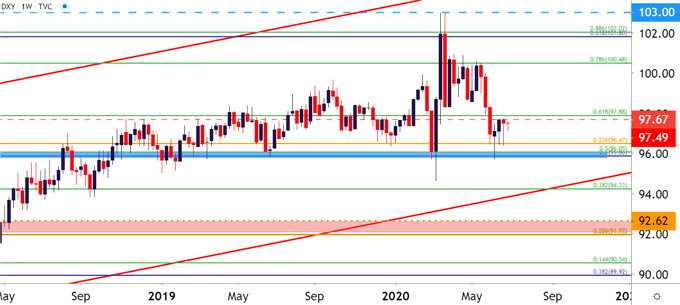
Starting off with the weekly chart to provide some context, the US Dollar has recently re-engaged with a huge zone of support. This runs from the 95.86-96.05 level on DXY, and this same zone helped to turn around the currency in March just before the mayhem that brought an 8.8% rally into the USD in about ten days.
Just above that zone is another level of relevance, taken from around 96.47 on DXY, which is the 23.6% Fibonacci retracement of the 2011-2017 major move. This price also helped to set support last week, after which price action jumped up to near-term resistance.
US Dollar Weekly Price Chart

Chart prepared by James Stanley; USD, DXY on Tradingview
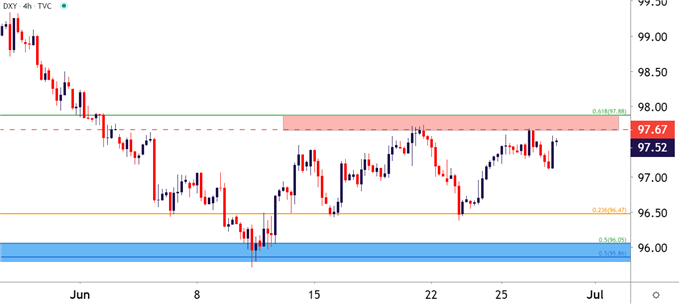
Going in a bit tighter to the four-hour chart, and we can observe a recent range that’s developed from the late-May, early-June sell-off. After that bearish trend ran into this key zone of support, prices jumped, after which a quick pullback found higher-low support around that 96.47 Fibonacci level. A bounce thereafter found resistance in a zone running from 97.67-97.88, which led to yet another test of the 96.47 Fibonacci level.
At this point, price action is posturing near resistance, looking like another test may soon be in store. But the direction that this moves, and the side of the range that’s inevitably broken will likely be determined by the tone from data released on this week’s economic calendar.
US Dollar Four-Hour Price Chart

Chart prepared by James Stanley; USD, DXY on Tradingview
--- Written by James Stanley, Strategist for DailyFX.com
Contact and follow James on Twitter: @JStanleyFX

