US Dollar, EURUSD, GBPUSD Price Analysis:
- The US Dollar broke down to a fresh low with an early-week breakdown.
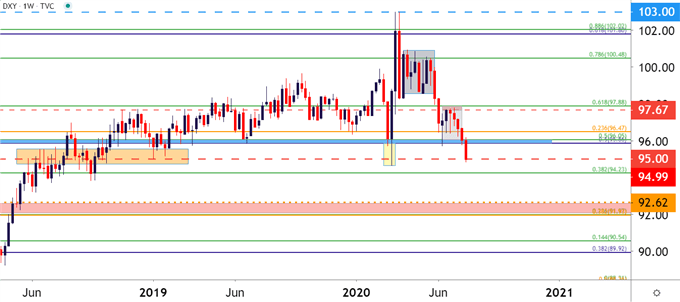
- DXY is now testing the 95.00 level, which had previously helped to set the yearly low in 2019. With this big level back in-play, can USD bears drive prices even lower?
- EUR/USD is testing a key resistance level; but GBP/USD has put in tones of bullish trend construction, keeping each pair as an item of interest for USD-strategies.
US Dollar Breakdown Tangles with a Big Level
We’ve just seen the rare occasion in which currency markets took at least some of the spotlight away from stocks. As the US Dollar broke down yesterday, a number of major pairs broke out and many markets are coming off of fresh yearly highs. EUR/USD and AUD/USD are two of the more popular areas that highlight that theme, but now that the US Dollar is perched down to a fresh low the natural next question is – what’s next?
The answer to that question is likely going to be dependent on the venue with which it’s being analyzed, as a continuation of USD strength may be a bit more difficult to imagine in EUR/USD or AUD/USD as bulls have continued to press each market with a minimum of pullback as big resistance zones have come into play.
At this point, the USD sell-off appears to be slowing after dipping below the 95.00 level on DXY. This level had previously helped to set the low for the currency in early-2019 and that yearly low held until the brief incursion in March. Now with this key price back in-play, will bears be able to generate enough weakness to constitute a lasting break?
US Dollar Weekly Price Chart

Chart prepared by James Stanley; USD, DXY on Tradingview
EUR/USD Breaks Out to Fresh Yearly Highs – Finds Fibonacci Resistance
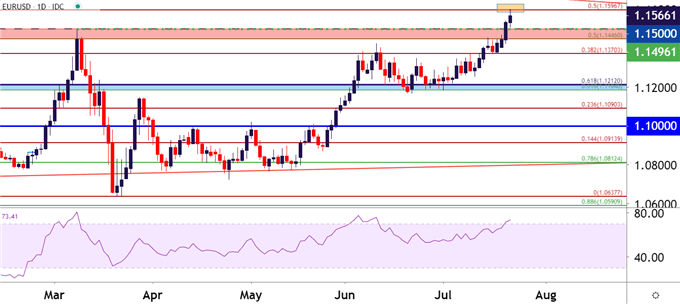
The most popular USD-pair of EUR/USD had a big breakout yesterday, helped along by some fundamental themes in Europe. This helped EUR/USD push up to a fresh yearly-high, taking out a number of resistance levels along the way. But, as of this morning, another resistance level has come into the equation and this resides at 1.1597, as the 50% marker of the 2018-2020 major move. This was highlighted earlier today by Ms. Tammy Da Costa in the article, Euro Price Analysis: EUR/USD Breaks Above Key Level of Prior Resistance.
With the pair stretched and holding around that fresh yearly high – the stage is set: If the USD does pose a deeper breakdown, EUR/USD can possibly push up towards the 1.1700 handle. Outside of that, a pullback in the USD sell-off could allow for a reversal-type-of-theme in EUR/USD from this resistance level.
EUR/USD Daily Price Chart

Chart prepared by James Stanley; EUR/USD on Tradingview
GBP/USD Pulls Back, Finds Support at Prior Resistance
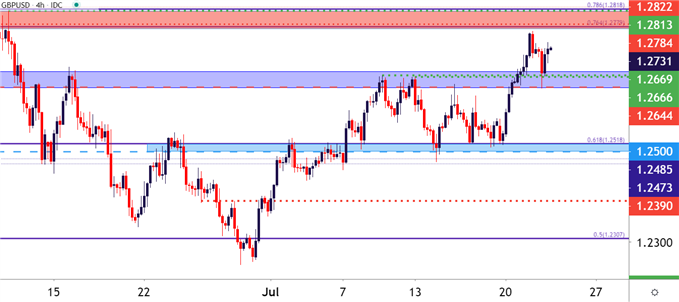
Similarly, GBP/USD has had a bullish outlay for much of Q3, driving up to a fresh monthly high to kick off this week. But, unlike the breakout in EUR/USD that just continued to run even whilst overbought, GBP/USD pulled back, found support at prior resistance, and has since began to move-higher. This may be a more attractive candidate for short-USD continuation scenarios given the potential for bullish trend continuation.
GBP/USD Four-Hour Price Chart

Chart prepared by James Stanley; GBP/USD on Tradingview
--- Written by James Stanley, Strategist for DailyFX.com
Contact and follow James on Twitter: @JStanleyFX


