US Dollar, EUR/USD, GBP/USD, AUD/JPY Talking Points:
- The US Dollar is testing a huge spot of support and tomorrow brings day two of Humphrey Hawkins, with Thursday bringing Durable Goods numbers and Friday PCE.
- Key to that USD breakdown is breakout potential in the Euro; but GBP/USD may actually be a more enticing option for scenarios of USD-weakness. Or, perhaps Yen pairs such as AUD/JPY could be a more attractive option for risk-on scenarios.
- The analysis contained in article relies on price action and chart formations. To learn more about price action or chart patterns, check out our DailyFX Education section.
It’s been a surprisingly strong show in the USD so far this year after the back nine months of 2020 saw a concerted sell-off in the currency. But, as I had warned in the Q1 technical forecast, the build of a falling wedge combined with some extreme oversold conditions coming into 2021 trade left the door open for a pullback scenario before the bigger picture bearish theme might take back over.
Well, now that we’re half-way through Q1, that’s essentially what we’ve seen. The USD bounced in the opening weeks of 2021 trade and over the past six weeks, we’ve seen the build of back-and-forth price action. That gyration has taken on the form of another formation, however, as there’s been a head and shoulders pattern that’s formed with a neckline just above the 90.00 handle on DXY.
This confluence around support can complicate breakdown scenarios as there’s just more reasons for buyers to support the bid given that we have not only trend/neckline support; but also psychological level support around the 90.00 handle on top of a series of prior price action swings.
To learn more about falling wedges, psychological levels or head and shoulders patterns, join us in DailyFX Education
US Dollar Eight-Hour Price Chart
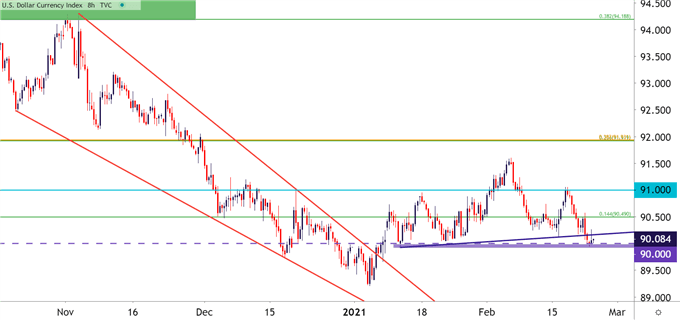
Chart prepared by James Stanley; USD, DXY on Tradingview
Going down to a shorter-term chart and we can see where bears have been making incremental progress. The trendline making up the neckline of the head and shoulders formation caught another support inflection yesterday, just a week after the prior inflection; but sellers remained aggressive on that most recent iteration and continued to drive thereafter, eventually pushing through the trendline and temporarily penetrating the 90.00 level on DXY.
But, that’s when selling pressure dried up – prices popped, albeit temporarily, and price action has tilted back down to this zone for another test. So, it would seem that support remains under assault, at least for now, and the USD might need a bit of help from another currency, looked at a little later, for this zone to finally give way.
US Dollar Hourly Price Chart
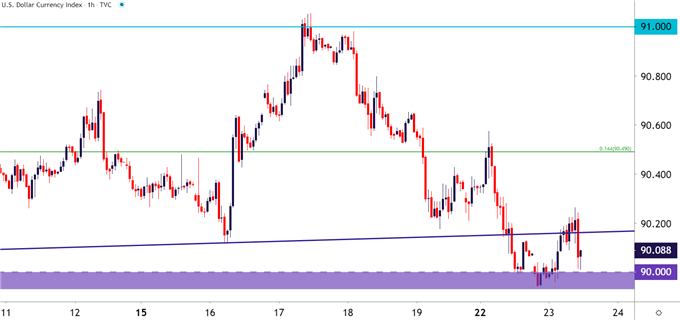
Chart prepared by James Stanley; USD, DXY on Tradingview
EUR/USD Snared at Resistance
If the US Dollar is going to break down, it’s likely going to need some element of an assist from the single currency.
EUR/USD remains snared at a big spot of resistance, running between two levels derived from longer-term Fibonacci studies and spanning from 1.2134-1.2167. This zone has been in play since early-December, as both support and resistance, and similar to the 90.00 level on DXY, this area of resistance has allowed for the build of a formation; although, this would be the mirror image of the above since USD is in the denominator of the EUR/USD pair.
On the below four-hour chart, we’re looking at an inverse head and shoulders pattern. This will often be approached with the aim of bullish breakouts, looking for buying pressure to eventually break through the neckline and leave that prior resistance behind.
To learn more about the inverse head and shoulders pattern, check out DailyFX Education
EUR/USD Four-Hour Price Chart
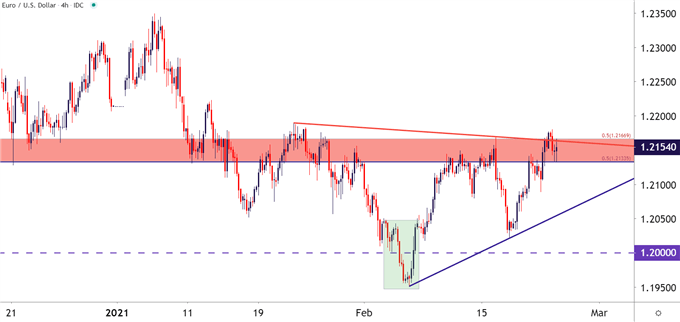
Chart prepared by James Stanley; EUR/USD on Tradingview
GBP/USD Rides to Fresh Highs
As I had looked at last week, for short-side USD plays, it appeared as though there were more amenable pastures elsewhere, such as GBP/USD.
That pair has continued to climb, even as the USD has been thwarted around key support and EUR/USD has been caught by resistance.
Cable is now trading above the 1.4000 handle for the first time since April of 2018. The trend is, by some accounts, overbought; but there is support potential around that 1.4000 psychological level that can keep the door open for bullish continuation scenarios.
GBP/USD Four-Hour Price Chart
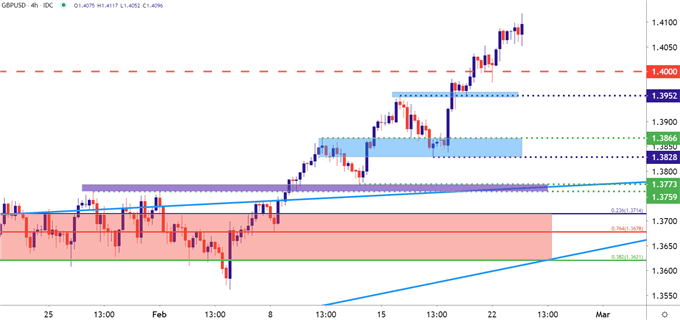
Chart prepared by James Stanley; GBP/USD on Tradingview
Yen Weakness Remains of Interest for Risk-On Themes
Also looked at in last week’s webinar – Yen weakness. This may actually be a more enticing theme for risk-on drives than the premise of USD weakness.
I had looked into a bullish breakout in AUD/JPY a few weeks ago, looking for a topside breach of an inverse head and shoulders pattern, and that’s filled-in as prices in the pair have jumped to fresh two-year-highs. And as the pair currently hangs very near that high water mark, support potential remains just a little lower around the 82.26 level of prior resistance.
AUD/JPY Four-Hour Price Chart
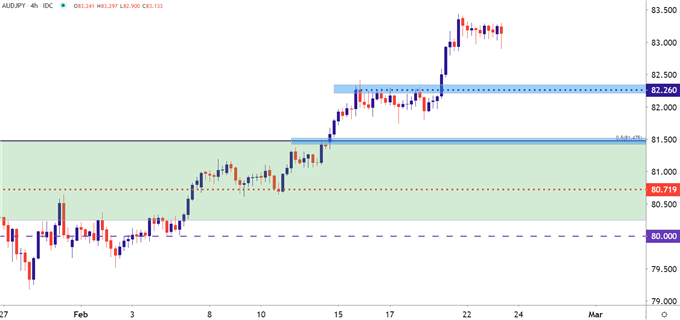
Chart prepared by James Stanley; AUDJPY on Tradingview
--- Written by James Stanley, Strategist for DailyFX.com
Contact and follow James on Twitter: @JStanleyFX


