US Dollar, USD, EURUSD, EUR/USD Price Analysis:
- This afternoon brought an FOMC meeting along with the first set of projections from the FOMC since the bank’s December rate decision.
- The Fed is looking at low rates for the foreseeable future, with the net impact thus far showing as lower treasury yields along with a quick shot of weakness into the USD and strength in stocks.
US Dollar Dips on FOMC as Stocks Set Fresh Highs
This was a well-awaited FOMC rate decision as it’s been about six months since we’ve received forward-looking projections from the bank. The last dot plot matrix was released from the Federal Reserve in December of last year. Of course, quite a bit has taken place since then which is part of what precluded the Fed from releasing projections at their March meeting; when, instead, they had to usher in an emergency rate cut.
In between these dot plot releases was about 30% of deviation in equity prices (larger in many equity indices), with US stocks largely recovering many of those losses; going along with a global pandemic and now a pretty high level of social unrest that remains through many parts of the country. This doesn’t even mention the Trillions in stimulus that have been added to the financial system in the effort of off-setting coronavirus-related losses. Oh, and there’s a Presidential election in less than five months that looks to be pretty contentious, so quite a bit is going on over the horizon and markets look primed for continued volatility as these themes continue to coalesce.
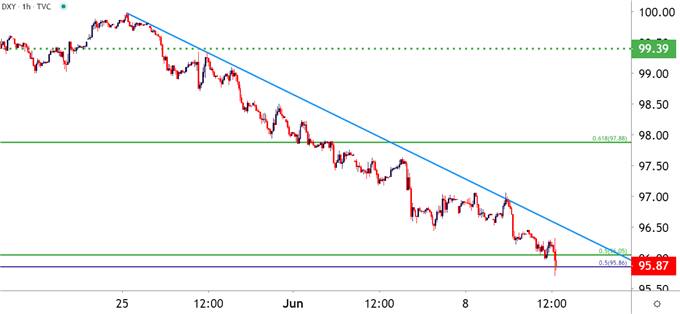
In the US Dollar, this afternoon’s FOMC rate decision provided another shot of weakness into the currency, although price action continues to brace onto a longer-term area of support. Near-term, the US Dollar has continued a sell-off that’s been three weeks in the making, with price action sticking below the identified trendline for much of the past few weeks; until that longer-term support began to come into play.
US Dollar Hourly Price Chart

Chart prepared by James Stanley; USD on Tradingview
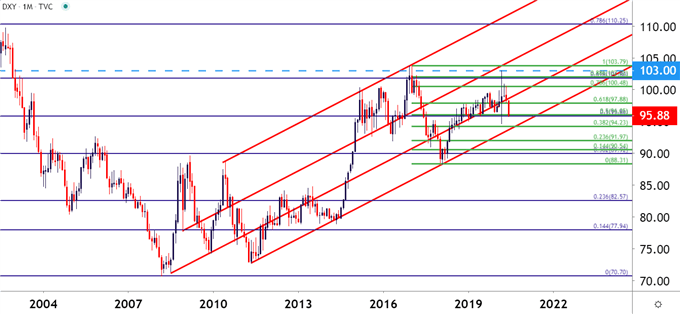
Taking a step back to look at that longer-term support – and the zone that runs from 95.86 up to 96.05 is a key zone on the chart. Each of those levels are derived from longer-term analysis, as the former level is the 50% marker of the 2001-2008 major move while the latter level is the 50% area of the 2017-2018 major move. So the stall of this down-trend, even with the FOMC driver, may make more sense when considering the longer-term context.
US Dollar Monthly Price Chart

Chart prepared by James Stanley; USD on Tradingview
EUR/USD Nears Key Resistance
If the US Dollar is going to continue to fall, then logically, other currencies will need to see strength; and the big question is which currencies may be most primed for strength in the event of an elongated sell-off in the US Dollar?
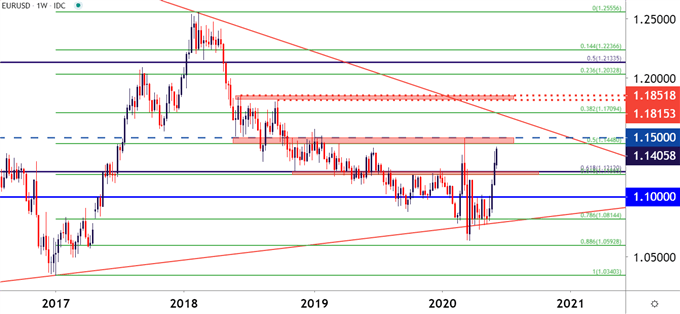
The Euro could be of interest, particularly considering the recent moves on the fiscal front in Europe. EUR/USD is making a run at a key area of prior support/resistance that rests from 1.1448-1.1500. This zone has most recently turned-around a bullish advance in March at the area that currently sets the yearly-high in the pair.
EUR/USD Weekly Price Chart

Chart prepared by James Stanley; EUR/USD on Tradingview
--- Written by James Stanley, Strategist for DailyFX.com
Contact and follow James on Twitter: @JStanleyFX

