US Dollar Index, DXY, Federal Reserve, Fiscal Aid Talks, US Presidential Election – Talking Points:
- Equity markets tracked broadly higher during the Asian trading session as investors seemingly dismissed the abrupt cessation in US fiscal aid talks.
- However, the absence of additional stimulus in light of weakening fundamental data may dampen market sentiment.
- US Dollar Index (DXY) poised to climb higher if price remains constructively perched above key support.
Asia-Pacific Recap
Regional equity markets moved broadly higher during the Asia-Pacific trading session, led by the Australian benchmark ASX 200 index’s 1.25% surge on the back of the local government’s Federal Budget announcement overnight.
Investors appeared to shrug off the abrupt cessation in US Congressional stimulus negotiations as the haven-associated US Dollar and Japanese Yen slipped lower against their major counterparts.
Gold climbed back above $1,880/oz and silver jumped over 2% despite a 2 basis point rise in US 10-year Treasury yields.
Looking ahead, minutes from the Federal Open Market Committee’s (FOMC) monetary policy meeting headline the economic docket alongside a slew of speeches from several members of the Federal Reserve.
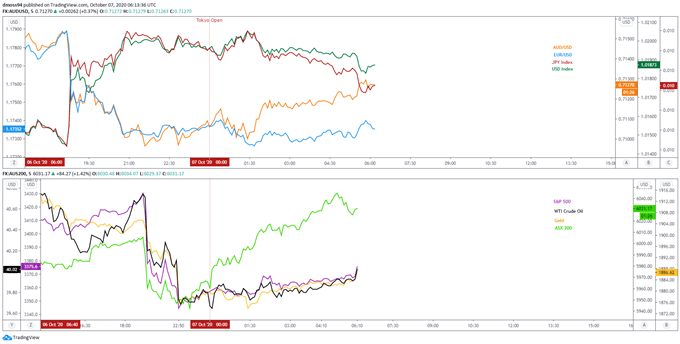
Market reaction chart created using TradingView
US Dollar Rebound to Gather Steam as Powell’s Pleas Go Unanswered
Haven inflows may fuel the US Dollar’s rebound higher in the coming days, as Federal Reserve Chairman Jerome Powell’s warnings of tragic economic consequences in the absence of additional fiscal aid went unheard by President Donald Trump.
Mr Trump decided to pull the plug on Congressional stimulus negotiations ahead of the US Presidential Elections on November 3, stating that “I have instructed my representatives to stop negotiating until after the election when, immediately after I win, we will pass a major Stimulus Bill that focuses on hardworking Americans and Small Businesses”.
This abrupt cessation in bipartisan talks may concern Chair Powell given his recent remarks stressed that “the expansion is still far from complete [and] too little support would lead to a weak recovery, creating unnecessary hardship”.
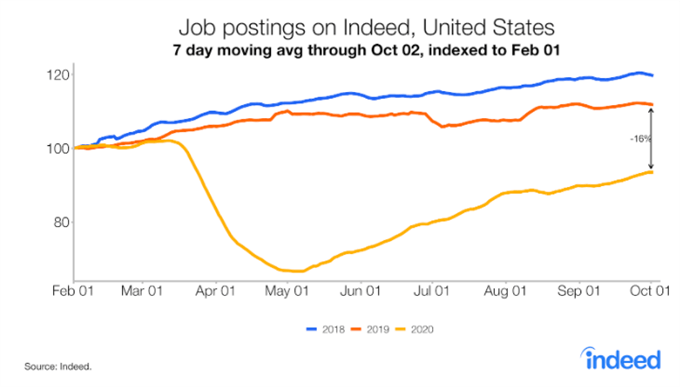
Source – Indeed, HiringLab
The question now becomes will the Federal Reserve seek to plug the gap in the interim considering it remains “committed to using its full range of tools to support the US economy in this challenging time, thereby promoting its maximum employment and price stability goals”.
However, the provision of additional monetary stimulus seems relatively unlikely prior to the November 3 elections, considering the central bank’s balance sheet has stabilized at $7 trillion since peaking at $7.17 trillion on June 10.
Nevertheless, with the trend in job postings on Indeed – the self-proclaimed number one jobs website in the world – 16.4% lower than October last year and permanent job losses continuing to rise, the need for additional stimulus may intensify in the near-term and in turn buoy the haven-associated US Dollar.
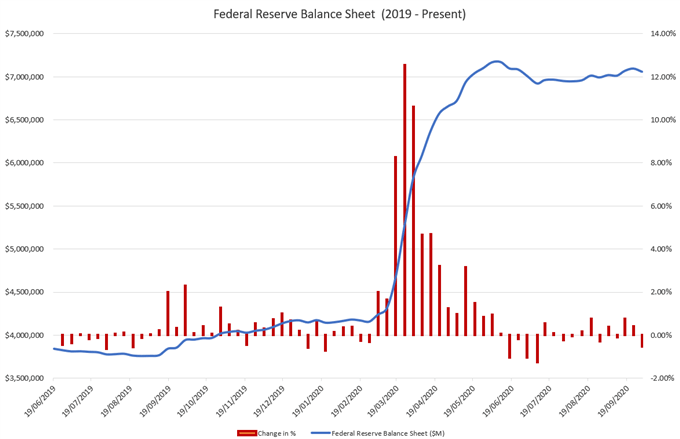
Source – Federal Reserve
US Dollar Index (DXY) Daily Chart – Inverse H&S Neckline Stifling Sellers
The US Dollar Index’s (DXY) rebound from the yearly low could gather steam in the coming days, as price validates the break of the Inverse Head and Shoulders reversal pattern carved out throughout August and bounces away from support at the trend-defining 50-day moving average (93.27).
The path of least resistance seems skewed to the upside as both the RSI and MACD indicators continue to track above their respective midpoints.
A break above confluent resistance at the downtrend extending from the yearly high (102.99) and psychologically imposing 94.00 mark would probably intensify buying pressure and generate a push to test the June low (95.72), if the DXY can successfully hurdle the March low (94.65).
Conversely, a daily close back below the 21-DMA (93.64) would probably encourage would-be sellers and could open the door for price to retest key support at the July low (92.55).
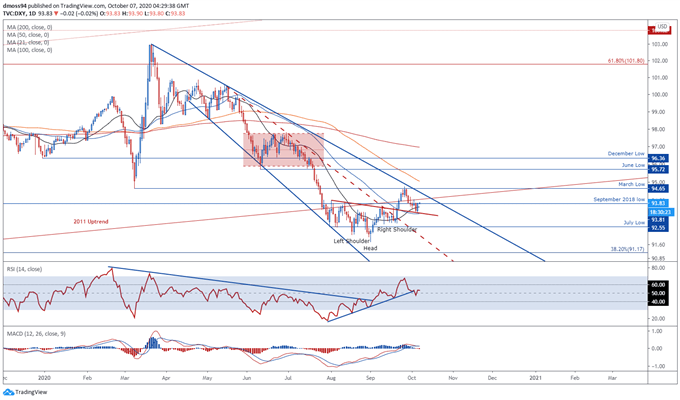
US Dollar Index (DXY) daily chart created using TradingView
US Dollar Index 4-Hour Chart – Falling Wedge Break Hints at Further Upside
Zooming into a 4-hour timeframe reinforces the bullish outlook depicted on the daily chart, as price breaks to the topside of a bullish Falling Wedge continuation pattern and spikes above resistance at the September 2018 low (93.81).
A bullish crossover on the MACD indicator in tandem with the RSI’s break above 50 is indicative of swelling upside momentum and could generate a push to test psychological resistance at the 94.00 mark, if the DXY can hurdle the 50-DMA (93.94).
A close above the March low (94.65) would probably carve a path for price to fulfil the bullish reversal pattern’s implied measured move (95.25) and potentially result in a test of key resistance at the June low (95.72).
However, if buyers fail to breach the 94.00 level a reversal lower seems more than likely, with a break back below the October 6 low (93.34) probably signalling the resumption of the primary downtrend and bringing the yearly low (91.75) into focus.
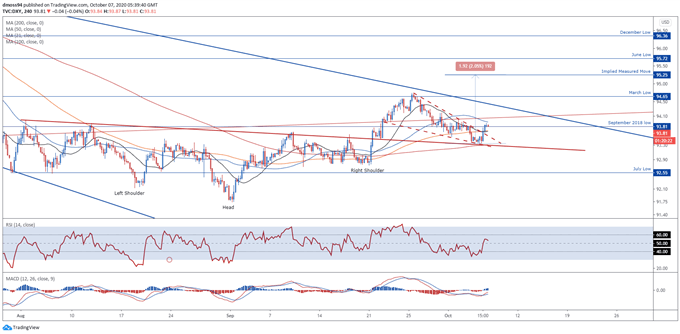
US Dollar Index (DXY) 4-hour chart created using TradingView
-- Written by Daniel Moss, Analyst for DailyFX
Follow me on Twitter @DanielGMoss

