US Dollar Price Forecast:
- The US Dollar has posed a bounce from a key area of chart support.
- USD has been mired in a sell-off since March.
- To learn more about price action, check out our DailyFX Education section, where it’s taught amongst a host of other candlestick patterns and formations.
USD Bounce Finds Sellers at Prior Support
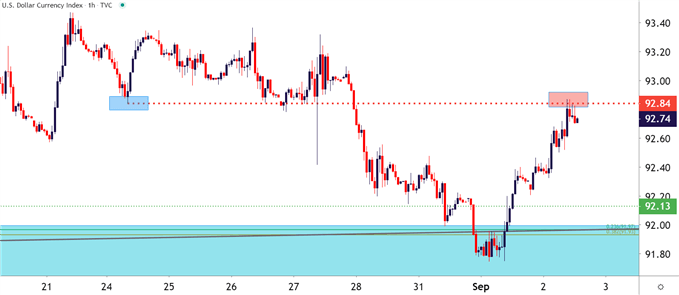
The US Dollar has put in a bounce over the past couple of days, coming at odds with the aggressively bearish trend that’s defined the currency’s tone over the past few months. As looked at in multiple articles over the past two days, that bounce in USD showed up at a big spot in the chart, as a confluent zone of support sits around the 92.00 level on DXY.
This morning produced a strong bounce off of that level; but on a short-term basis, that move is facing one of its first real tests as a bit of resistance has begun to show off of a prior support level. This raises the question as to whether USD-buyers will be able to continue the move, and likely contributing to the answer of that question is what happens around the Friday Non-Farm Payrolls report.
US Dollar Hourly Price Chart

Chart prepared by James Stanley; USD, DXY on Tradingview
Can USD Bulls Re-Engage with the Longer-Term Trend?
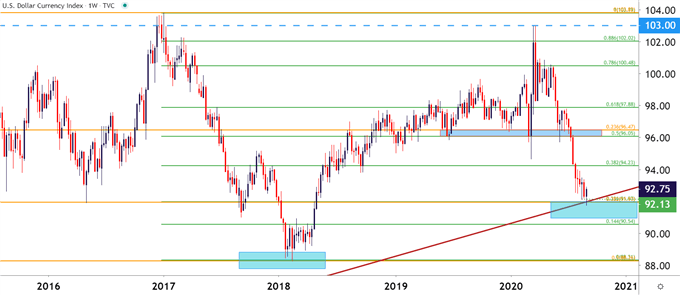
Coming into 2020, the US Dollar had spent much of the prior year showing a persistent drive of strength. While this strength certainly wasn’t unabated, with resistance continuing to help temper the highs to a degree, there was a very strong adherence to support in the second-half of 2019 around the 96-96.50 area on the chart.
The coronavirus pandemic getting priced into markets threw a wrench in that equation as the USD went haywire in February-March, helping to violate a number of levels on longer-term charts. But – that big zone of prior support continues to lurk above price action; and as of yet, that huge zone prior support has yet to be tested for resistance. This area is quite a ways from current prices, so likely the USD will need a prolonged bout of strength if this zone is to come back into play, but on a shorter-term basis, resistance potential exists around the 94.23 spot on the chart which is the 38.2% retracement of the 2017-2018 major move in the USD.
US Dollar Weekly Chart

Chart prepared by James Stanley; USD, DXY on Tradingview
--- Written by James Stanley, Strategist for DailyFX.com
Contact and follow James on Twitter: @JStanleyFX

