US Dollar, NFP, EUR/USD, GBP/USD, USD/CAD Talking Points:
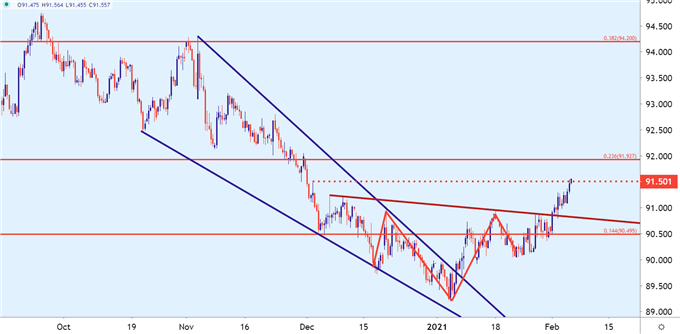
- The US Dollar continues to gain after this week’s bullish break above the inverse head and shoulders pattern.
- Tomorrow brings Non-farm Payrolls along with the release of Canadian jobs numbers, setting up a very interesting stage in USD/CAD.
- The analysis contained in article relies on price action and chart formations. To learn more about price action or chart patterns, check out our DailyFX Education section.
It’s been a busy week in the US Dollar as the bullish reversal continues to take-hold. This was in the spotlight during January trade as a number of reversal formations began to set up. Even coming into the New Year, the US Dollar carried bullish potential as shown by a falling wedge pattern. Falling wedges are denoted by a more aggressive slope from trendline resistance compared to what’s showing at or around support. These can often show up around market bottoms with oversold conditions, and will often be approached with the aim of bullish reversals.
To learn more about the falling wedge, check out DailyFX Education
And for much of January, price action remained at least somewhat indecisive, gyrating in either direction; but along the way another formation popped up as an inverse head and shoulders pattern built-in. Similarly, this formation will often be approached with the aim of bullish breakouts, and as the door has opened into February trade, that’s precisely what’s happened so far. I talked about this at length in the Tuesday webinar, and I had also highlighted this scenario in last week’s Analyst Pick.
To learn more about the inverse head and shoulders pattern, join us in DailyFX Education
Tomorrow’s calendar brings one of the most-followed US data releases with Non-farm Payrolls. This report is being released at the same time as Canadian jobs numbers, setting up for a very interesting scenario in USD/CAD, which we’ll look at a little later. But – for the US Dollar, price action has been long and strong, with prices bursting up to a fresh two-month-high. And with a couple of major banks revising expectations for tomorrow higher around the NFP report, the bar will be high for USD bulls to continue the break. But – if they can, there’s a major level around the 92.00 handle that may come into play if/when the breakout extends.
US Dollar Eight-Hour Price Chart

Chart prepared by James Stanley; USD, DXY on Tradingview
EUR/USD Breaches 1.2000 – Can Sellers Take it Down?
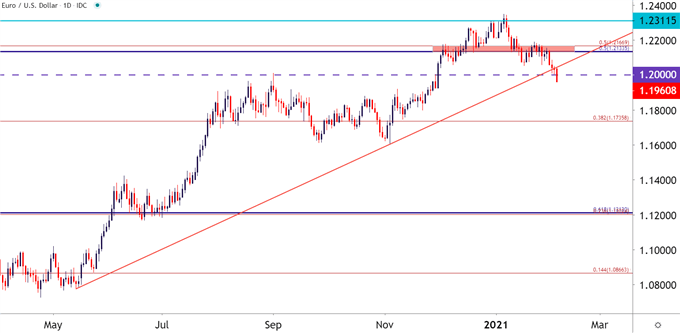
Perhaps one item of surprise this week has been how quickly EUR/USD gave-up around the 1.2000 handle. When this psychological level came into play as resistance back in September of last year, it led to a strong reversal that lasted for more than a few weeks and accounted for almost 400 pips.
Coming into this week, that price loomed ominously below; and there was even an minor bounce yesterday before that exact price could come into play. But sellers woke up with aggression this morning as the single currency drove-lower, EUR/USD broke below 1.2000 and well, at least as of this writing, hasn’t really stopped.
The complication here would be an oversold situation going into what could be some intense headline risk with tomorrow’s jobs reports. But – given the levels that were taken-out, there could be some context for continuation, particularly if that news report could help to bring on a quick flicker of strength in the pair, so that one of these areas of prior support may show-up as near-term resistance.
EUR/USD Daily Price Chart

Chart prepared by James Stanley; EURUSD on Tradingview
GBP/USD Jumps as BoE Tamps Down Negative Rate Potential
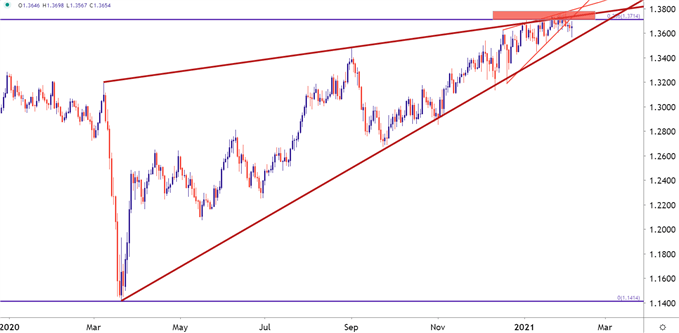
I had looked at a rising wedge formation in GBP/USD during the Tuesday webinar. To be more accurate, there were actually two wedges that were being looked at – one short-term and one long-term. The short-term wedge had already started to give way to USD-strength, with the pair falling to a fresh three-week-low. But the longer-term wedge did remain unfettered as the support trendline still has yet to be tested.
To learn more about rising wedges and why they’re often followed for bearish reversals, check out this article in DailyFX Education
The big item of change here took place this morning around the Bank of England rate decision, at which the BoE took on a positive tone and seemingly tamped down the possibility of a near-term move into a negative rate regime. This allowed the pair to jump, with short-term price action taking out a number of prior lower-highs.
At this point, the big question is whether Cable can finally take out the 1.3750 zone of resistance that helped to hold the highs for a few weeks before the reversal started to show. From a fundamental vantage point, given the BoE’s statement this morning, if we do see USD-weakness, the bullish side of Cable may look more attractive.
GBP/USD Daily Price Chart

Chart prepared by James Stanley; GBPUSD on Tradingview
USD/CAD Loaded for US and Canadian Jobs Reports
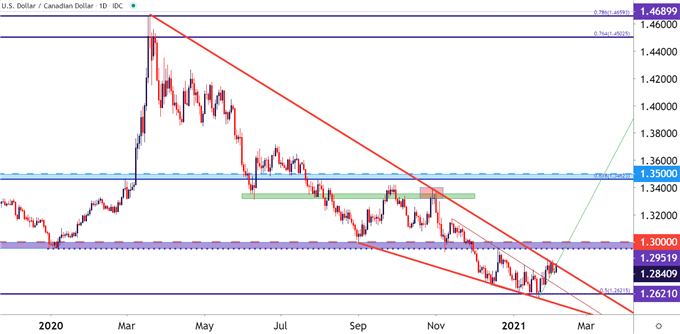
USD/CAD remains very interesting as there’s a similar ‘wedge within a wedge’ backdrop in the pair. However – unlike GBP/USD above, USD/CAD has shown greater development with these formations as the short-term wedge was breached last week, and the longer-term wedge remains in-play this morning.
Resistance as taken from the trendline making up the topside of the wedge saw tests over four consecutive trading days, until yesterday, that is. Yesterday’s price action printed as a doji, and this keeps the door open for a morning star formation for today’s price action. That can’t or won’t be confirmed until the daily close, but it does keep the door open for bullish breakout potential in the pair.
The big zone looming ahead on USD/CAD is the 1.2952-1.3000 zone. The psychological level has been in-play multiple times in multiple ways over the past couple of years. But, so far in 2021 trade, there has yet to be a test at or above this level, keeping the door open for bullish breakout potential particularly with the two jobs reports on the calendar for tomorrow.
To get more acquainted with psychological levels as support and/or resistance, join us in DailyFX Education
USD/CAD Daily Price Chart

Chart prepared by James Stanley; USDCAD on Tradingview
--- Written by James Stanley, Strategist for DailyFX.com
Contact and follow James on Twitter: @JStanleyFX

