US Dollar Index, HEALS Act, US Nonfarm Payrolls Report, Jobless Claims, Permanent Job Losses – Talking Points:
- Geopolitical tensions fueled risk aversion as market participants look ahead to US nonfarm payrolls for July.
- Climbing permanent job losses in the United States may continue to hamper the US Dollar.
- USD Index carving Bear Flag at key resistance after falling to its lowest levels since May 2018
Asia-Pacific Recap
Escalating US-China tensions notably weighed on investor sentiment throughout Asia-Pacific trade, as President Donald Trump’s executive order prohibiting US firms from doing business with Chinese-owned WeChat and TikTok fueled haven inflows.
The executive order comes into effect 45 days from now and follows on from Trump’s threats to shut down TikTok if the company’s owners – ByteDance - fail to facilitate a sale of the highly-addictive application to a US corporation by September 15.
Given WeChat is run by one of China’s most valuable tech companies – Tencent – retaliatory escalation from Beijing is almost a certainty and could lead to period of sustained risk aversion.
The haven-associated US Dollar and Japanese Yen rose against their trade sensitive counterparts after the announcement whilst gold prices retreated from fresh record highs.
Developments should continue to be watched in the upcoming session, with a vitriolic response from China probably fueling haven inflows and anchoring global risk assets.
Looking ahead, the US jobs report for July could prove market-moving, with the unemployment rate expected to decline 0.6% to 10.5%.

Non-Farm Payrolls on Tap
The upcoming US nonfarm payrolls (NFP) report may underpin the Greenback’s tentative recovery against its major counterparts, should the volatility-inducing monthly release exceed expectations of a further 1.58 million jobs added to the local economy in July.
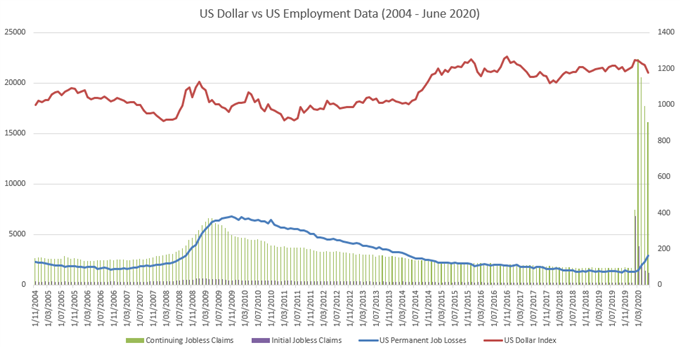
This would build on yesterday’s positive jobless claims data with both continuing and initial claims declining to the lowest levels since the pandemic began.
However, longer-term employment measures continue to climb as 2.89 million employees claimed to have permanently lost their jobs in June, jumping by a staggering 588,000 in just 4 weeks.
Unfortunately these numbers look set to rise as the novel coronavirus hampers the return to normalcy in several US states, intensifying the pressure on Congress to deliver additional fiscal stimulus measures to support the nascent economic recovery by building “on what worked in the CARES Act”.

Source – Bloomberg, Bureau of Labor Statistics
Therefore, it seems rational to expect that positive employment data could buoy the US Dollar, showing that the situation may not be as dire as first thought and keeping the ever-supportive Federal Reserve temporarily at bay.
Nevertheless, with permanent job losses rising significantly and US policymakers “trillions of dollars apart” according to White House Chief of Staff Mark Meadows, a positive NFP report may only serve to ease the intensity of USD selling seen in recent days and allow the under-fire currency to climb out of oversold territory.
Disappointing data likely exacerbating the Greenback’s decline with investors positioning for the provision of further monetary stimulus from a Federal Reserve that remains “committed to using our full range of tools to support the economy in this challenging time”.
US Dollar Index (DXY) Daily Chart – Bear Flag Continuation Pattern in Play

USD Index (DXY) daily chart created using TradingView
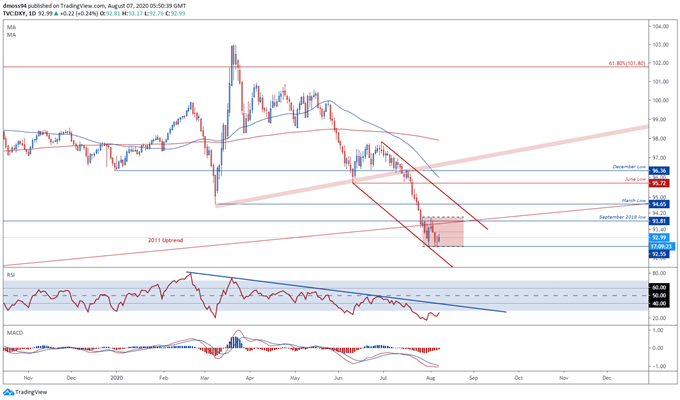
From a technical perspective, the US Dollar may extend its tentative recovery from the yearly low (92.52) as RSI divergence hints at underlying exhaustion in the recent plunge below the 2011 uptrend.
A push back to resistance at the September 2018 low (93.81) looks on the cards, as the RSI attempts to climb out of oversold territory for the first time since July 21 and the MACD eyes a cross back above its ‘slower’ counterpart.
The path of least resistance remains to the downside should price remain capped by the 94.00 mark, with a near-term recovery potentially carving out a Bear Flag continuation pattern at key resistance and probably coinciding with RSI respecting its downtrend extending from the yearly extremes.
Conversely, a daily close above the September 2018 low may invalidate the bearish continuation pattern and hint at a more sustained recovery to test resistance at the March low (94.65).
-- Written by Daniel Moss, Analyst for DailyFX
Follow me on Twitter @DanielGMoss

