FOMC Interest Rate Decision, US Dollar, Monetary Policy, Federal Reserve Balance Sheet – Talking Points:
- The upcoming FOMC interest rate decision may exacerbate the US Dollar’s recent decline
- USD looks set to extend its losses against its major counterparts after snapping through long-term trend support.
Asia-Pacific Recap
A mixed day of trade during the Asia-Pacific session saw the ASX 200 nudge higher, despite the Australian consumer price index falling 1.9% in the three months through June.
The Nikkei 225 dropped 0.72% after Fitch Ratings downgraded Japan’s outlook from stable to negative. Gold pulled back from its record high, whilst silver stalled above the $24/oz mark.
The US Dollar continued to slide against its major counterparts as the risk-sensitive Australian Dollar climbed 0.27%.
Looking ahead, the upcoming FOMC rate decision headlines the economic docket with Chairman Jerome Powell and the committee expected to retain their dovish forward guidance for monetary policy.
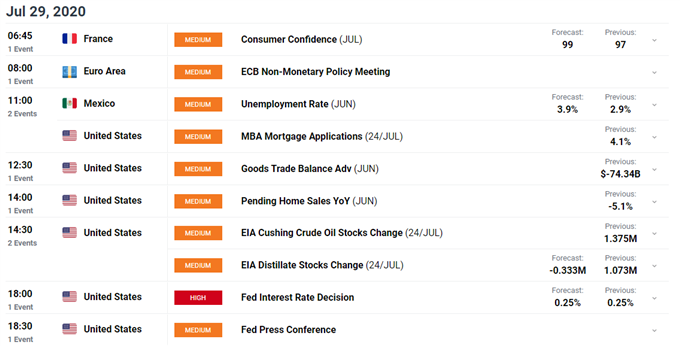
US Dollar Hangs on Upcoming FOMC Meeting
The US Dollar may extend declines against its major counterparts as the Federal Reserve looks set to continue supporting “the flow of credit to households and businesses” after announcing, “an extension through December 31 of its lending facilities that were scheduled to expire on or around September 30”.
This extension comes ahead of the Federal Open Market Committee’s (FOMC) interest rate decision, suggesting that the board may continue to lean on lending facilities and its asset purchasing program to “help the economy recover from the COVID-19 pandemic”, as the central bank’s balance sheet looks set to balloon back above $7 trillion.
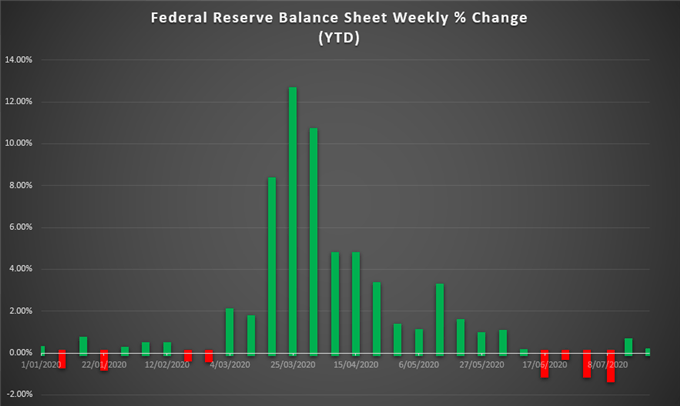
Source – Federal Reserve
With the central bank monitoring “the implications of incoming information related to public health”, accommodative monetary policy looks set to stay for the foreseeable future as cases of the novel coronavirus climb past 4.4 million.
To that end, intent focus will be given to Federal Reserve Chairman Jerome Powell’s press conference, with an overtly dovish tone potentially exacerbating the Greenback’s decline against its major counterparts.
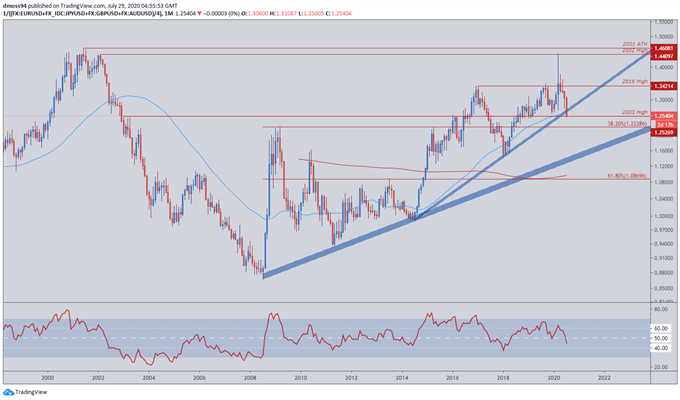
US Dollar Index** Monthly Chart – Break of 2014 Uptrend Suggests Further Declines
US Dollar Index monthly chart created using TradingView
**USD Index averages EUR/USD, GBP/USD, AUD/USD, JPY/USD
Zooming out to a monthly timeframe highlights the magnitude of the US Dollar’s decline in recent weeks, as price takes out the uptrend extending from the 2014 low (0.9884) and begins to test support at the 2003 high (1.2527).
The Greenback looks set to extend its declines as the RSI dives below 50 into bearish territory and price breaks below the trend-defining 50-month moving average (1.2644).
A sustained slide towards the 38.2% Fibonacci could be on the table should price successfully close below the 2003 high (1.2527) and validate the break of 6-year trend support.
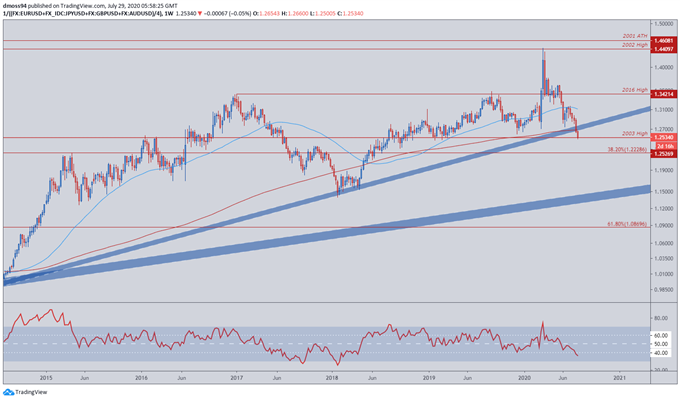
US Dollar Index** Weekly Chart – Break of 200-WMA Could Accelerate Losses
US Dollar Index monthly chart created using TradingView
**USD Index averages EUR/USD, GBP/USD, AUD/USD, JPY/USD
Jumping into a weekly timeframe reinforces the bearish outlook for the liquidity-rich currency, as price easily slices through supportive confluence at the 200-WMA (1.2690) and 2014 uptrend.
Selling pressure may intensify as the RSI dives below 40 for the first time since early 2018, potentially driving price below the 2003 high (1.2527) and carving a path for price to test the 38.2% Fibonacci (1.2289).
Entry of the oscillator into oversold conditions probably coincides with a break below the 1.22 level.
However, sellers still need a weekly close below 1.25 to validate bearish potential.
US Dollar Index** Daily Chart – RSI Hints at Short-Term Recovery
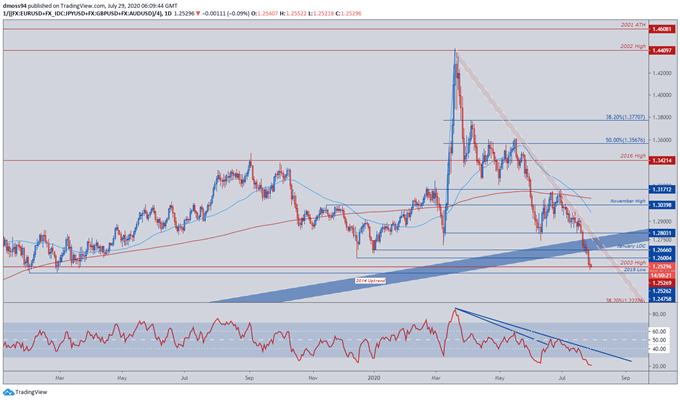
US Dollar Index monthly chart created using TradingView
**USD Index averages EUR/USD, GBP/USD, AUD/USD, JPY/USD
Finally, the daily chart may provide USD bulls with some encouragement as the RSI just exceeds the extremes of early June, despite the haven-associated currency collapsing over 5% against its major counterparts in July.
This divergence between the oscillator and price suggests underlying exhaustion in the recent surge to the downside, as sellers fail to breach pivotal support at the 2019 low (1.2476).
With that in mind, a short-term recovery could see price retest the January low daily close (1.2666) and downtrend resistance extending from the yearly high (1.4428).
-- Written by Daniel Moss, Analyst for DailyFX
Follow me on Twitter @DanielGMoss


