US Dollar Index, DXY, Coronavirus Relief Bill – Talking Points:
- Coronavirus relief bill talks may underpin the haven-associated US Dollar ahead of the Senate’s break for summer recess on August 7.
- The US Dollar Index (DXY) looks poised for further losses after slicing through pivotal 9-year support
- However, oversold conditions may result in a short-term correction in the DXY
Asia-Pacific Recap
The ASX 200 nudged higher during Asia-Pacific trade, shrugging off developments in Victoria, Australia’s second most populous state, as Premier Daniel Andrews announced a state of emergency in response to a surge in Covid-19 infections.
The haven-associated US Dollar and Japanese Yen rose as tensions between the US and China drag on investor sentiment, with the Trump administration expected to widen its measures on Chinese-owned software corporations.
Gold dipped back below $1,975/oz after surging to a fresh record high earlier in the session.
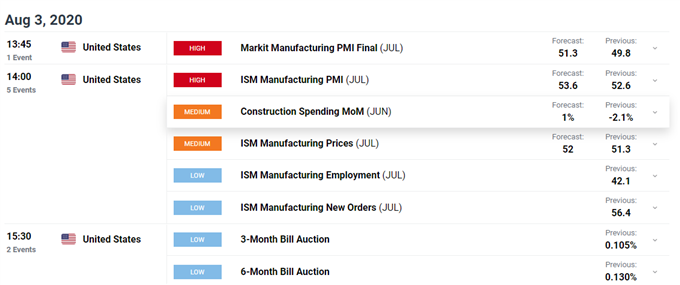
Looking ahead, upcoming US manufacturing PMI data may prove market-moving as investors monitor coronavirus relief bill talks.

Stagnating Negotiations May Underpin the USD
Ideological differences are hampering coronavirus relief package negotiations, as policymakers bump heads over a proposed $400 reduction to current weekly unemployment benefits.
With Democrats “unified” in their support for continuation of the enhanced $600/week program, White House Chief of Staff Mark Meadows is “not optimistic that there will be a solution in the very near term”.
Meadows’ lack of optimism is justified when accounting for Treasury Secretary Steven Mnuchin’s statements suggesting enhanced payments result in people refusing to return to work, as “there’s no question in certain cases we’re paying people more to stay home than to work”.
As cases of Covid-19 surge towards 5 million, pressure is intensifying on Capitol Hill to successfully ratify the proposed $1 trillion HEALS Act ahead of the Senate’s break for summer recess on August 7.
To that end, lack of progress ahead of the August 7 deadline may put a floor under the US Dollar, with disappointing manufacturing data potentially fueling haven inflows and underpinning the Greenback against its major counterparts.
USD Index (DXY) Monthly Chart – Ominous Signs for USD Bulls

USD Index monthly chart created using TradingView
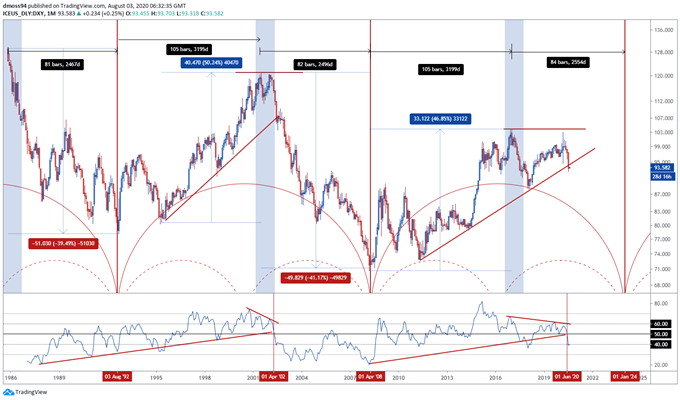
The US Dollar has taken a battering since soaring to 19-year highs in March (102.99), sliding over 14% against its major counterparts and collapsing through 2011 uptrend support.
Further losses may be in the offing for the world’s reserve currency as the RSI snaps its constructive trend, diving below its neutral midpoint for the first time in two years.
Moreover, the haven-associated USD seems to largely adhere to what appears to be a 8-year rotation, suggesting that the Greenback could be entering a cyclical downturn.
In fact, the decline seen in 2002 ensued when the US Dollar broke the uptrend extending from the 1996 low, which ignited a 40% sell off, with the Greenback finally bottoming in mid-2008.
USD Index (DXY) Daily Chart – Break of 2011 Uptrend Could Ignite Selling

USD Index (DXY) daily chart created using TradingView
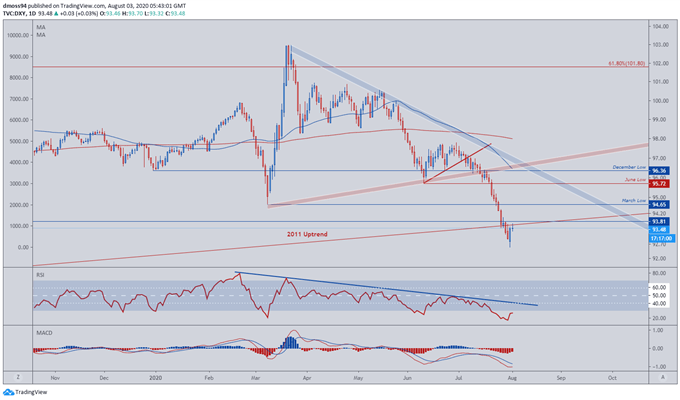
However, zooming into a daily timeframe suggests the US Dollar may stage a short-term recovery, after the RSI collapsed into oversold territory for the third time this year.
A daily close back above resistance at 93.80 could eventuate in the coming days as the ‘faster’ MACD line’s gradient notably turns positive, potentially carving a path for USD to climb back towards the March low (94.65).
Having said that, the dollar’s recovery could remain capped by the September 2018 low (93.81), validating the break of the 2011 uptrend.
Should this eventuate, a resumption of the yearly downtrend looks a likely scenario and may lead price to fresh yearly lows.
-- Written by Daniel Moss, Analyst for DailyFX
Follow me on Twitter @DanielGMoss

