US Dollar, EUR/USD, GBP/USD Talking Points:
- Despite a bullish run in equities this week and some very provocative headlines and themes – the US Dollar has been fairly quiet, all factors considered.
- While EUR/USD bearish scenarios previously looked attractive for USD-strength themes, there may be a shift in the opposite direction as the pair grasps on to support to continue a series of higher-highs and lows.
- The analysis contained in article relies on price action and chart formations. To learn more about price action or chart patterns, check out our DailyFX Education section.
One might’ve figured, given all of the headlines over the weekend, that some volatility may be on the horizon across global markets. But, for most intents and purposes, this week has been downright quiet in the FX-space; as the US Dollar has trickled into a trend of digestion and this can be extrapolated across a number of major currency pairs.
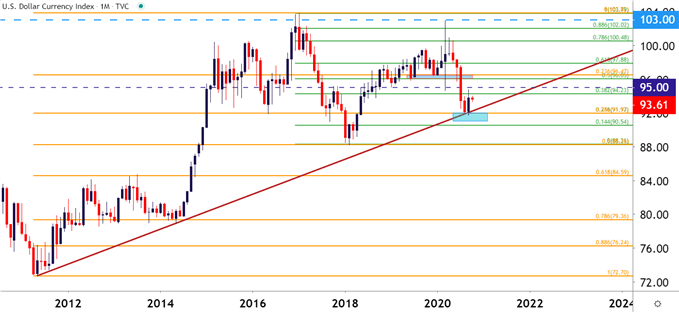
In USD, the question of direction remains. The bigger-picture backdrop continues to carry a bearish quality, as the short-side move off of the March highs was loud and visible for about five months; until running into a huge area of support on the chart on September 1st. After that support came into play, so did a directional change as the USD chugged higher for much of September, giving rise to the potential of an elongated bullish trend. September price action closed as a bullish engulfing bar on the monthly chart, and this is the type of formation that’ll often be approached with the aim of bullish continuation.
US Dollar Monthly Price Chart

Chart prepared by James Stanley; USD, DXY on Tradingview
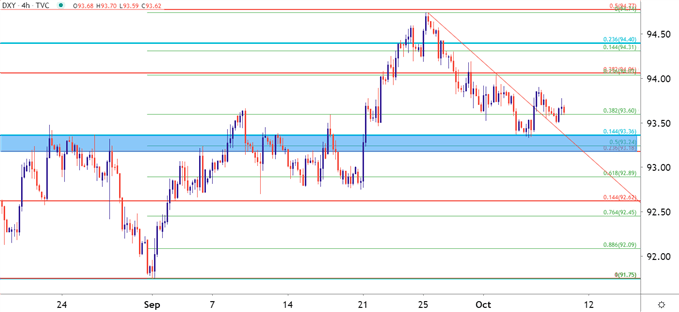
On a shorter-term basis, there’s an item of support in the US Dollar that remains in-play. This was looked at earlier this week during the Tuesday webinar; and this can keep the door open for short-term bullish scenarios for the currency.
A little lower in this article, I take a look at GBP/USD, which may be set up attractively for scenarios of USD-strength. And on the other side, EUR/USD may hold some attraction for those looking at situations of USD-weakness.
US Dollar Four-Hour Price Chart

Chart prepared by James Stanley; USD, DXY on Tradingview
EUR/USD Settles at Support
Going back to August, EUR/USD was one of my favored ways of looking for USD-strength, largely based on the prospect of resistance holding around the 1.2000 big figure. That level showed up on September 1st and the pair then went into a fairly aggressive sell-off last month.
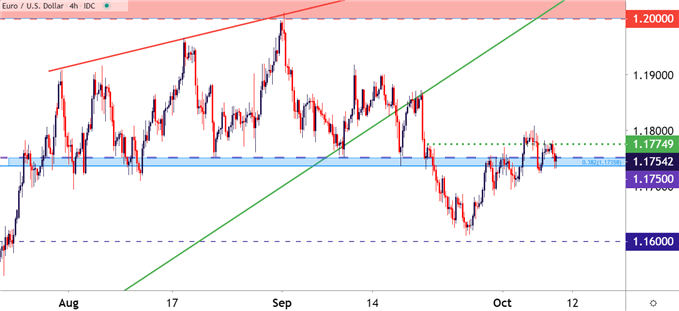
But, of late, that bearish price action has been receding and the weakness that’s shown in the USD has certainly filtered into EUR/USD. At this point, EUR/USD appears to be attempting to set support at another higher-low. This comes in around a key spot on the chart, an area that was previously used to set-up resistance for short-side plays in September. But, with a current show of potential support around that area of prior resistance, coupled with higher-lows and recent higher-highs, that paradigm may be shifting.
Current support shows from 1.1736-1.1750. The latter of those prices is the 38.2% retracement of the 2014-2017 major move and the former is a major psychological level.
EUR/USD Four-Hour Price Chart

Chart prepared by James Stanley; EUR/USD on Tradingview
GBP/USD: Another Rejection at 1.3000
On the other side of the matter, I had previously followed GBP/USD for themes of USD-weakness, looking for another re-test of the 1.3000 psychological level which could, possibly, keep the door open to topside breakouts.
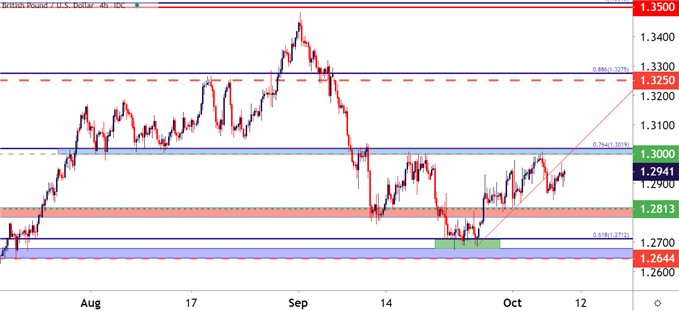
That 1.3000 level came into play on Monday. But similar to mid-September, bulls couldn’t do much thereafter. Prices pulled back on Tuesday and have been climbing higher over the past couple of days; but the question remains as to whether buyers will ultimately be able to break back-above the 1.3000 psychological level. After a bout of a month of range-bound price action, that window for bullish breakouts may be closing and this can keep the door open for short-side scenarios in the pair – looking for themes of USD-strength to push GBP/USD back down towards support in the 1.2785-1.2815 area on the chart.
Below that, secondary support potential exists around the 1.2712 Fibonacci level.
GBP/USD Four-Hour Price Chart

Chart prepared by James Stanley; GBP/USD on Tradingview
--- Written by James Stanley, Strategist for DailyFX.com
Contact and follow James on Twitter: @JStanleyFX

