US Dollar, EUR/USD, AUD/USD, GBP/USD Price Analysis
- The US Dollar is breaking down to fresh three-month-lows.
- As USD breaks down, many majors are breaking out including EUR/USD, AUD/USD and GBP/USD.
- The big question now is one of continuation, and the potential for how each of these moves have been priced-into various pairs to allude to probabilities of continued trends.
US Dollar Breaks Down to Fresh Lows as Support Could Hold No Longer
The US Dollar is pushing down to a fresh three-month-low today as sellers have finally pushed price action below the big zone of support that runs/(ran) from 95.86-96.05. As looked at in this week’s Technical Forecast for the US Dollar, the USD had seen an increasing frequency of tests at the big support zone that’s been in play since early-2019. The lower-highs that had built so far through Q3 didn’t bode well for USD bulls, and after posturing around support most of the day on Monday, sellers finally took a swing on Tuesday morning to break the US Dollar down to fresh three-month-lows.
At this point, support potential remains around the 95.00 level that had previously helped to set support in 2019, followed by the March low hanging around at the 94.67 level on the chart. This does go along the lines of what was looked at in the Q3 Technical Forecast for the US Dollar, in which I was looking at a bearish bias for the currency in the current quarter.
US Dollar Eight-Hour Price Chart
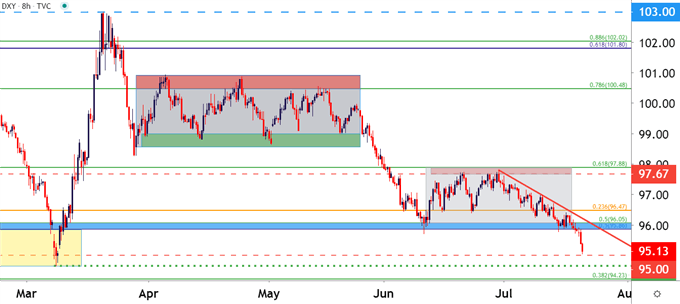
Chart prepared by James Stanley; USD, DXY on Tradingview
EUR/USD Fresh Yearly High – Can Bulls Maintain Above 1.1500
Psychological levels have a funny impact across markets. I know of many who out-of-hand dismiss these levels as potential inflections; but if there was no impact, why would most major retailers use the strategy of ending prices in increments of 99 cents or 99 pence? It makes things seem cheaper, psychologically, and in my opinion, the same type of thing can be seen across markets.
Case in point, when EUR/USD was rushing higher in early-March, the move stopped just 3.9 pips shy of the 1.1500 level. And there’s a similar case in Aussie, where the AUD/USD pair just spent a month trying to finally break-above the .7000 handle.
EUR/USD is now trading above 1.1500 for the first time in over a year. The big question now is whether bulls can maintain? A daily close below the 1.1500 level, leaving an upper-wick above the psych level, could open the door for possible reversal strategies. But, outside of that, the trend has been rather strong, and higher-low support potential remains at areas just inside of the 1.1500 handle, looked at on the hourly chart of EUR/USD below.
EUR/USD Hourly Price Chart
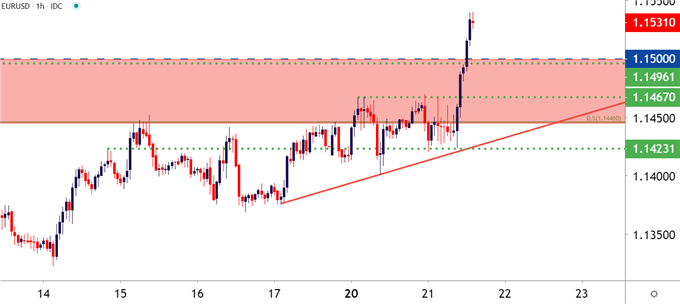
Chart prepared by James Stanley; EUR/USD on Tradingview
AUD/USD Takes Out the .7000 Handle
As touched on above, AUD/USD has been in the midst of a fairly concerted battle at the .7000 handle. The pair perched up to a fresh high of .7032 on the final trading day of last year; but that helped little as sellers went for the jugular in the first few months of 2020 trade. The AUD/USD pair eventually set a fresh decade low, almost encroaching on the .5500 handle. But just as quickly as prices had slid in Q1, buyers pushed the bid in Q2 until almost the entirety of that move was erased, with price action re-engaging with the .7000 handle in early-June.
Since then, its been slow going, even with the build of some bullish formations such as the bull pennant that showed earlier in July. But this recent push of USD-weakness is what’s finally helped AUD/USD to push up to a fresh yearly high. The big question now, similar to many of these breakout scenarios, is the prospect of continuation.
Prior resistance can be looked to for higher-low support potential; and just ahead on the chart is a confluent area of resistance potential around the .7200 handle.
AUD/USD Weekly Price Chart
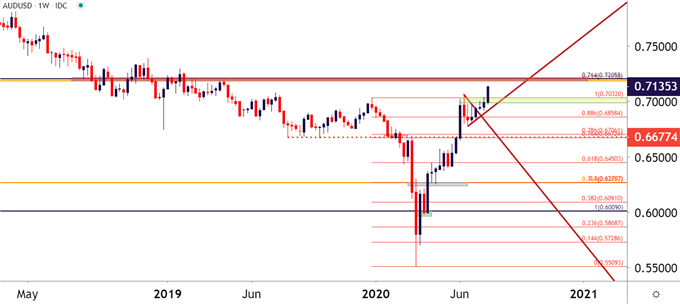
Chart prepared by James Stanley; AUD/USD on Tradingview
GBP/USD Breaks Out – Resistance Nearing
It was just last week that GBP/USD was getting comfortable around the 1.2500 psychological level. But given this recent influx of USD-weakness, combined with what looked to be some fairly attractive GBP-strength beforehand, and GBP/USD has broken-out with aggression.
But – unlike EUR/USD and AUD/USD above, where there do not seem to be any nearby areas of resistance potential, GBP/USD is fast approaching the same zone that turned around the June advance. This is between the 76.4 and 78.6% Fibonacci retracements of the February-March major move, and a hold of resistance in this area can keep the door open for reversal scenarios. This can sync with bullish USD strategies, looking for reversal/pullback themes in DXY off of the 95.00 level.
GBP/USD Daily Price Chart
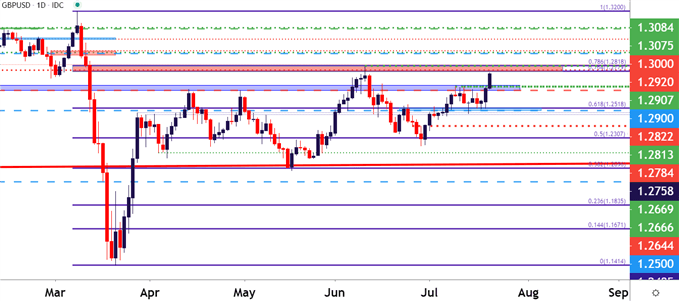
Chart prepared by James Stanley; GBP/USD on Tradingview
--- Written by James Stanley, Strategist for DailyFX.com
Contact and follow James on Twitter: @JStanleyFX


