US Dollar Price Action
- It was a brutal day for the Greenback as the currency set yet another fresh two-year-low.
- Longer-term context is similarly bearish, as the recently completed November monthly bar confirmed the build of an evening star formation, which will often be followed with the aim of bearish continuation.
- The analysis contained in article relies on price action and chart formations. To learn more about price action or chart patterns, check out our DailyFX Education section.
It’s been a pretty active morning so far in the US and the stage is setting up for an interesting NFP release later this week. Jerome Powell offered commentary at 10am ET this morning, and this pushed a weak US Dollar over the ledge to set a fresh two-year-low. A little later in the morning, President-Elect Joe Biden introduced his economic team during a press conference, which includes former FOMC chair Janet Yellen as incoming Treasury Secretary, assuming she passes Senate confirmation. But the Yellen pick was not new ‘news,’ as this was circulating last week to the widespread jubilation across markets. Perhaps not coincidentally, two of the major hallmarks of her tenure atop the bank came into the spotlight, as equities gained while the USD weakened.
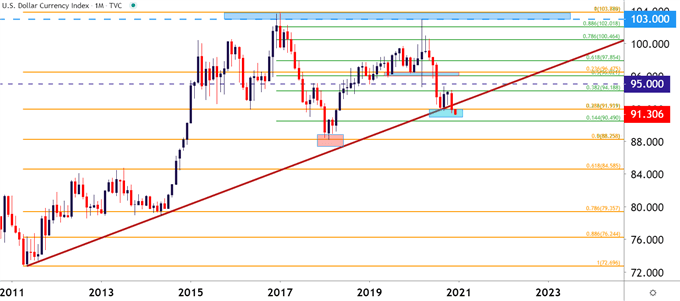
But USD weakness isn’t a sudden phenomenon as the Greenback has been offered for much of the time since the March spike. There was a brief reprieve in September, after a big area of support came into play on DXY. That led to a bounce that lasted for a little over three weeks, but sellers were back and dominating the flow through the month of October.
The Presidential Election provided a shot of weakness into the currency, and that theme has been extending since early-November. But it was this week and, more to the point, today that saw that big confluent support area finally taken out in the US Dollar.
US Dollar Monthly Chart: Breach of Confluent Support to Fresh Two-Year-Lows

Chart prepared by James Stanley; USD, DXY on Tradingview
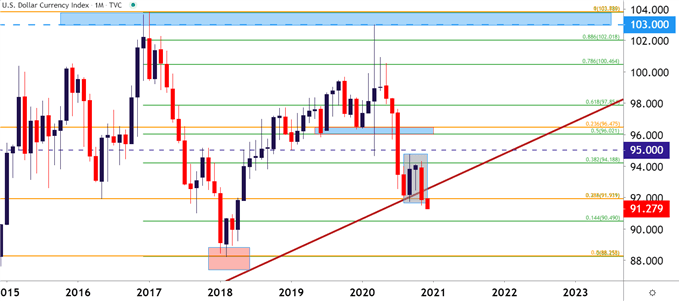
Also of interest for longer-term projections that can be taken from the above monthly chart – a now completed and confirmed evening star formation. This is a three-candle-sequence marked by a) a strong move b) a month of indecision and then c) a reversal of a that takes out at least 50% of that move.
Well, with September, October and November price action – we now have that criteria met in USD. September saw the currency bounce from a big support zone, October saw a stall that produced a hammer or dragonfly doji; and November was a brutal month for the Greenback that saw the entirety of that bounce priced-out.
Collectively, this formation points to the possibility of deeper losses in the Greenback, as evening star formations will commonly be followed for follow-through of the reversal.
To learn more about evening star formations, join us in DailyFX Education
US Dollar Monthly Chart: Evening Star Complete

Chart prepared by James Stanley; USD, DXY on Tradingview
--- Written by James Stanley, Strategist for DailyFX.com
Contact and follow James on Twitter: @JStanleyFX


