Silver Price Forecast Talking Points:
- Two weeks ago I looked at breakout potential in Silver, and the following Monday saw Silver prices set a fresh seven-year-high.
- That breakout couldn’t hold at the $30 level, however, and prices quickly pulled back. This exposes a possible double top formation that could prelude a deeper reversal; but there’s also a bullish case to be made as looked at below.
- Do you want to learn more about Global Macro? DailyFX Education has launched a new sub-module of content on the topic, focusing on major economies in North America, Asia and Europe. Click here to check out DailyFX Education.
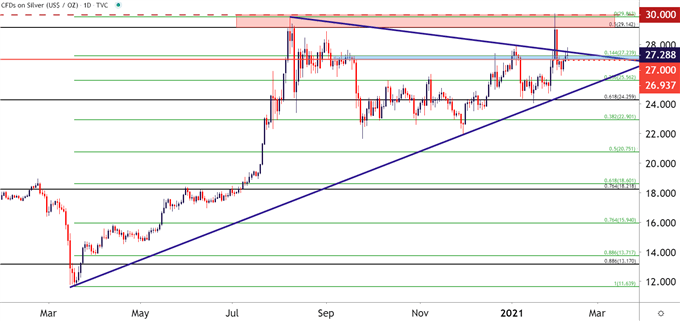
It’s been a wild two-week run in Silver prices and there’s a number of reasons for it. But let’s first start with the ‘what.’ Silver prices jumped to begin last week’s trade, temporarily testing above the $30 level, which helps to mark a near eight-year-high in the precious metal.
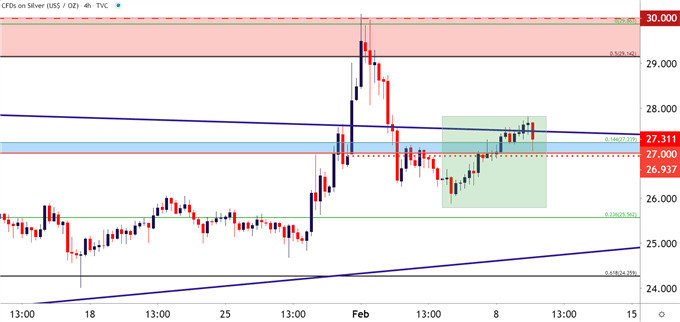
That strength didn’t last for long, however, and prices quickly pushed back down to the $26.00 handle; finally firming a low around last Thursday after which buyers have come back into the equation. Friday was especially beneficial to bulls, as a rocky NFP print helped to bring back USD-weakness and this helped to contribute to that topside move in Silver.
So far this week, bulls have continued to push, re-claiming ground above the $27 handle as risk assets have been similarly strong as evidenced by another fresh all-time-high in both the S&P 500 and Bitcoin. I started looking into Silver a couple of weeks ago as prices had just begun to re-engage with the $27 handle. I highlighted the breakout potential here, with emphasis on the psychological level of $30 sitting above price action. But, now that that breakout has taken place and buyers were unable to continue the move – is there hope for bulls that Silver prices might finally leave that $30 level behind as fresh highs come into the picture?
Silver Daily Price Chart

Chart prepared by James Stanley; Silver on Tradingview
Why the Breakout Happened and What Traders Can Look For
One of the common refrains across markets last week as Silver was breaking out was the insinuation that it was another reddit-driven short squeeze scenario. Perhaps there’s some truth to that, but it’d be difficult to distill whether or not that’s the case and, further, how much of an impact that this may or may not have had.
From the realm of technical construction, the potential for a breakout was there, as I had pointed out previously. But, for forward-looking conditions, the question remains as to whether or not Silver bulls can continue the trend or whether we’re looking at a reversal scenario in the not-too-distant future; and there’s a case for either, which I’ll look at below.
Silver Bear Thesis: Double Top Plus Inflation Sensitivity and Possible USD Strength
Perhaps the most impressive aspect of that Silver breakout was the fact that it took place in an environment of general USD-strength. There’s more often a negative correlation between the US Dollar and precious metal prices, but that seemed to matter little as the breakout in Silver flew higher to start last week’s trade.
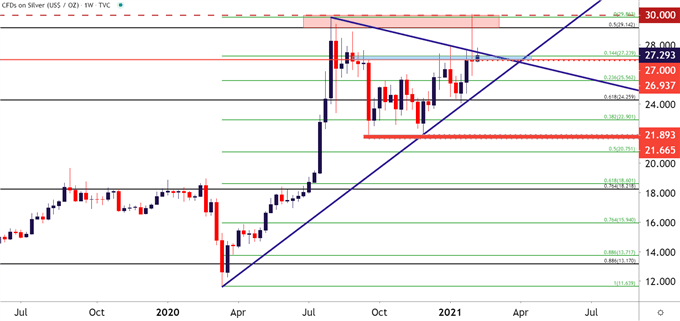
But – the fact that last week’s high merely touched the prior high, and quickly receded, opens the door to the fact that this may have been a double top formation. This hasn’t yet been confirmed, and won’t be until the ‘neckline’ of the formation is tested through, which I have on my chart around the 21.67-21.89 area. If price action does breach below this, there may be continued short-side movement as this is how a double top reversal is often approached. There’s also the possibility of a sizable measured move below that support, which could put Silver prices back in the range that they were trading in around May-June of last year.
To learn more about the double top formation, check out DailyFX Education
For this to come to fruition, we’d likely need to see a very strong run of USD-strength, which would likely need to be driven by headline flow, whether that be from an inflation print such as what’s on the calendar for tomorrow, or some unknown risk factor that shows from out of the blue.
Silver Weekly Price Chart

Chart prepared by James Stanley; Silver on Tradingview
Silver Bull Thesis: Higher-Highs, Risk-On Bonanza and Psychological Level Resistance
Going with the flow can often be the most accommodative way of addressing matters and, big picture, the flow in Silver has been generally higher. Last week’s resistance inflection could possibly be dismissed by a major test at a key psychological level that hadn’t been in-play for more than eight years.
Pulling on that string – Gold prices easily took out that prior all-time-high in August. Silver prices did not, as Silver topped just inside of 30 while the all-time-high lurks around the 50-handle. That divergence, combined with a continued shift in the Gold-Silver ratio could possibly support preference to Silver prices, particularly should the risk-on bonanza, driven by USD-weakness or the prospect thereof, continues similar to what’s shown in the post-election backdrop.
It's not unusual for a psychological level, especially a major one, to elicit a strong reaction when it first comes back into the picture. That may have been the case with Silver prices and the response over the past few days has been encouraging on that front, as a shorter-term series of higher-highs and lows has developed on the chart.
To learn more about the power of psychological levels on charts, check out DailyFX Education
On a short-term basis, that same zone of resistance that I had looked at two weeks ago is currently functioning as support. A hold here appears key to continued progress in the short-term bullish trend in Silver.
Silver Four-Hour Price Chart

Chart prepared by James Stanley; Silver on Tradingview
--- Written by James Stanley, Strategist for DailyFX.com
Contact and follow James on Twitter: @JStanleyFX

