Silver Price Forecast, Silver Talking Points:
- While much of the financial world’s attention has been on Gold, Silver had a much stronger run in the month of July.
- That silver trend ran into a key area of longer-term resistance, and has since snapped back with a very large sell-off showing yesterday.
Gold’s Run was Big, but Silver’s was Bigger
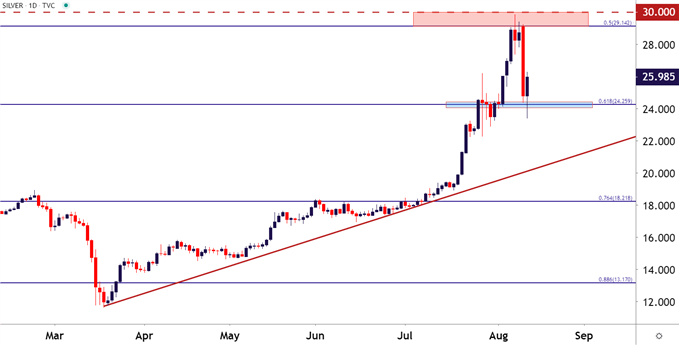
July was a really big month for Gold, and by this point, you probably already knew that as most economic outlets have been keenly focused on the price of the precious metal. And in a month when Gold gains as much as 18%, that attention makes sense. But silver prices put in a significantly stronger move in July, jumping by as much as a 68% as prices drove to fresh seven-year-highs.
Silver prices ran into a key area of resistance last week that has since held buyers at bay. This level shows at 29.14, which is the 50% marker of the post-Financial Collapse move in Silver prices. That price held the highs on Friday of last week and again on Monday of this week; and yesterday’s outsized pullback saw prices dip all the way to the 61.8% retracement of that same major move, which has since come in to help provide support.
Silver Daily Price Chart

Chart prepared by James Stanley; Silver on Tradingview
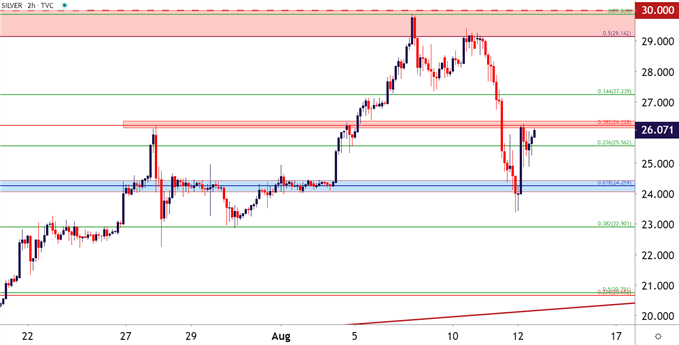
Adding an additional Fibonacci retracement from the 2011 high down to the 2020 low brings another level of relevance into play. The 38.2% retracement of that major move plots at 26.23, and this price caught a resistance inflection this morning.
{{GUIDE| BUILDING_CONFIDENCE_IN_TRADING}}
Silver Two-Hour Price Chart

Chart prepared by James Stanley; Silver on Tradingview
Silver Strategy Moving Forward
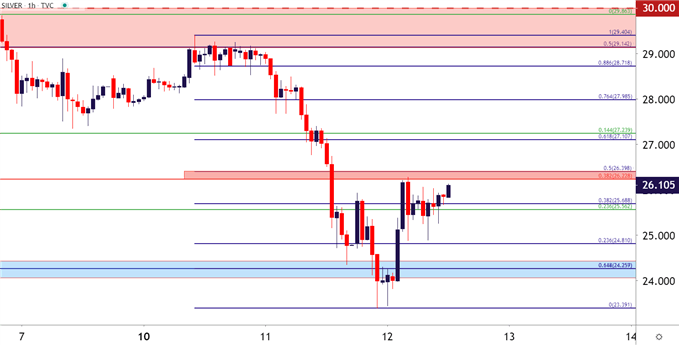
Taking an even shorter-term look at the matter and this recent attempt at recovery from Silver bulls becomes a bit more evident. And also, there’s a bit of additional value in the current zone of resistance as a Fibonacci retracement added to this week’s sell-off shows a 50% marker at 26.40, which creates a bit of confluence with the longer-term level around 26.23.
{{GUIDE| TOP}}
Also of note, resistance inflections appear to be showing a diminishing impact, as noted by the build of higher lows underneath recent price action. This takes on similar logic as an ascending triangle formation, in which a horizontal level of resistance shows weaker and weaker resistance inflections until, eventually, buyers are able to break through.
To learn more about the ascending triangle, check out DailyFX Education
This can keep the door open to bullish breakout potential in Silver prices. But, if bulls are unable to take out this key zone of confluent resistance, there’s likely more room to go on the downside as a very overbought theme from the month of July may need more than one day of reversion before bulls are ready to stoke the trend for a longer-term, bigger picture move that eventually allows for a break-above the 30-handle.
Silver Hourly Price Chart

Chart prepared by James Stanley; Silver on Tradingview
--- Written by James Stanley, Strategist for DailyFX.com
Contact and follow James on Twitter: @JStanleyFX

