S&P 500, Nasdaq Talking Points:
- This morning’s NFP report came out very strong, with 4.8 million jobs added last month.
- US equities jumped on the heels of that release, with the Nasdaq 100 jumping up to another fresh all-time-high as the S&P 500 jumped up to a key zone of resistance.
- Tomorrow is a Federal holiday in the US and US exchanges will be closed in observance of Independence Day. This can lead to lower liquidity conditions across macro markets going into the weekend.
NFP Prints with Strength, Stocks Jump in Response
This morning’s NFP report showed a whopping 4.8 million jobs added to American payrolls in the month of June. This is one of the largest NFP prints ever so, we can say that it’s historical in nature, although we’d probably want to add an asterisk next to that number considering everything that’s happened in the past few months.
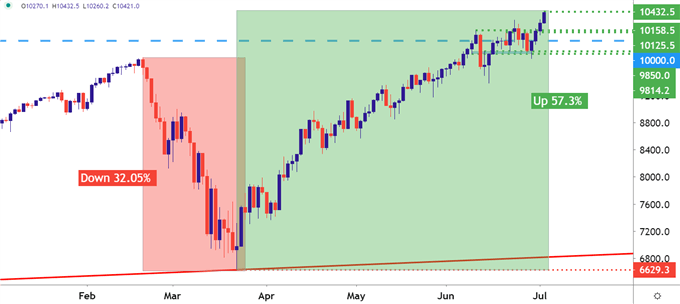
At this point, despite the continued increase in Covid-19 cases across many areas of the US, hopes remain for a brisk recovery as economies have started to re-open. This morning’s NFP release speaks to that, as this blockbuster print helped to bring bulls into the fray. The Nasdaq 100 is now trading at another fresh all-time-high – a full 57.3% away from the March low.
Nasdaq 100 Daily Price Chart

Chart prepared by James Stanley; Nasdaq 100 on Tradingview
S&P 500 Drives into Resistance
The equity rally in the S&P 500 hasn’t been quite as robust as what’s shown in the Nasdaq 100. But the index has been well-bid nonetheless, gaining by as much as 52.9% from the March low up to the June high.
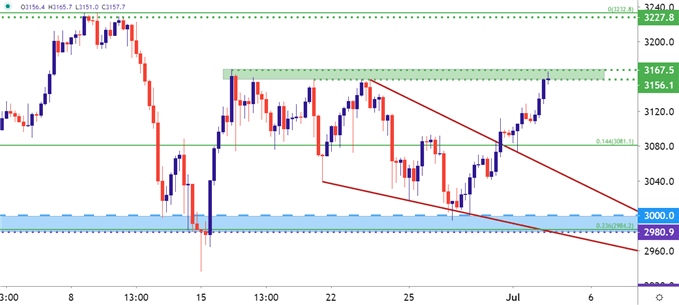
A notable recent divergence, however, is the fact that the Nasdaq 100 is still setting fresh all-time-highs while the S&P 500 has been a bit more subdued, remaining underneath the high that was set in early-June. And for the past few weeks, the area around 3150 has been a key spot of resistance, bringing in three separate inflections until coming back into play this morning.
As looked at earlier this week, there was a falling wedge formation in the S&P 500, with a base around support that helped to hold the lows. But the big question now is whether bulls can finally punch through this key zone of resistance that’s held the highs over the past few weeks. Beyond this zone of resistance is the all-time-high that was set a few weeks ago.
S&P 500 Four-Hour Price Chart: Return to Resistance

Chart prepared by James Stanley; SPX500 on Tradingview
--- Written by James Stanley, Strategist for DailyFX.com
Contact and follow James on Twitter: @JStanleyFX


