S&P 500 Price Analysis
- Another ugly day in global markets as Coronavirus fear continues to spread.
- Economic slowdown from virus impact appears a near-certainty.
- Global governments have begun to prepare for containment strategies – but is this enough to slow the spread? Global markets don’t yet appear convinced.
S&P 500 Slammed Lower – Limit Down for Second Time This Week
It’s been a very busy past month in global markets and, unfortunately, that looks set to continue. What started off as a seemingly small problem in the Hubei province of China has now become a global pandemic, and developed nations like the United States appear to be at tipping point as the virus has already started to spread; already taking hold in Europe’s second and third largest economies.
Particulars of the virus make it especially dangerous: It can incubate for up to five days before symptoms show, allowing for a wide spread amongst unknowing carriers. And while it’s generally most dangerous in the most vulnerable portion of the population, the elderly and those with underlying medical conditions; the virus does not necessarily discriminate as it’s been known to take a profound toll on even young, healthy individuals.
There is no cure, and the potential for a cure does not appear to be nearby. There is but one strategy to try to manage the impacts of the virus, and that’s social distancing. This requires people to stay at home as much as possible, avoiding possible contaminants in the hope that, eventually, the virus is choked out of the population. Even then, the best hope is that the spread can be slowed to the point that the medical system can treat those that require help. Germany yesterday said that up to 70% of the population may catch the virus, and that’s a frightening figure.
The downside on social distancing is the economic impact that’s a near-certainty. If people are staying at home, they aren’t spending money; at least as much as they would otherwise. This puts enormous strain on small businesses at a time when the economic backdrop wasn’t necessarily great to begin with. And large businesses will suffer as well, as will entire industries like airlines, cruise operators, restaurants.
It’s impossible to estimate at this point the potential for capital destruction. Central Banks have started to lay the groundwork for accommodation and we’ve seen some movement out of the US federal government. It appears as though we’re still in the phase where markets are ‘pricing in’ this new risk that’s looking more and more like a black swan event.
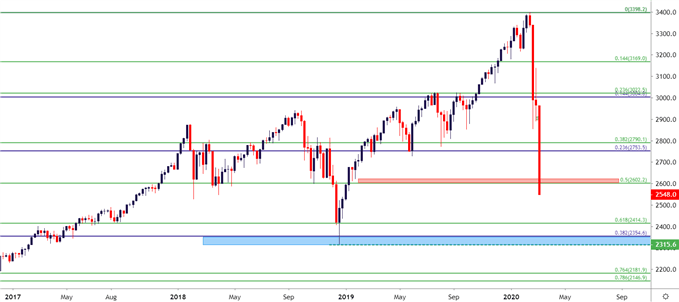
In the US, the S&P 500 is now officially in a bear market, losing more than 20% of its value in a short and violent four-week-stretch. Price action has retraced 50% of the move that started from the lows in 2016; and for the second time this week S&P futures hit the limit down band ahead of the US equity open.
S&P 500 Weekly Price Chart

How Low Can This Go?
Black swans are rare by definition. Thusly there’s a dearth of prior examples from which to draw inferences. We can, however, estimate that the bottom is not yet in given the fact that Coronavirus cases appear to be growing exponentially in the United States and shutdown efforts haven’t yet been enacted in many vulnerable areas.
There aren’t really even recent historical examples to compare: This is unlike SARS or the Ebola scare of a few years ago. There’s also the collateral damage, such as the carnage that’s already taken place in Oil markets that will likely snare banks that have extended loans to producers. All of this makes estimating damage or even addressing vulnerabilities a massive problem.
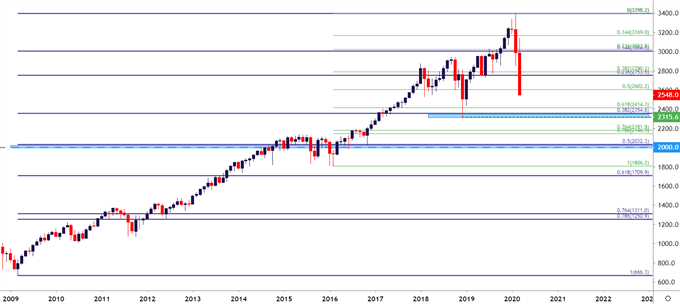
Taking a further step back on the chart, incorporating the post-Financial Collapse run, the S&P 500 has just crossed below a crucial support level around 2753 that, up until yesterday, was helping to hold the lows.
That level has now been smashed through. Prices in the S&P 500 appear headed for the 2500 level on the chart. That may not hold the low, either; but a bit lower is another reference point of interest, taken from the lows in December of 2018 that line up near the 38.2% retracement of the decade-long bull market.
Given the pace of recent declines, that area around 2315-2354 could be an optimistic estimation: A bit-lower is a bigger threshold around the 2000 marker, which aligns with the 50% retracement of the post-GFC major move.
S&P 500 Monthly Price Chart

SPX500 on Tradingview
--- Written by James Stanley, Strategist for DailyFX.com
Contact and follow James on Twitter: @JStanleyFX

