S&P 500 Index, Coronavirus Vaccine, US Senate, Blue Wave – Talking Points:
- Asian equity markets moved broadly higher during APAC trade on positive Covid-19 vaccine news.
- Senate Majority Leader Mitch McConnell’s push for a skinny fiscal aid bill may weigh on US benchmark equity indices.
- However, the outside chance of a Democratic-majority Senate may underpin risk-sensitive assets.
- S&P 500 index poised to move higher after holding above key confluent support.
Asia-Pacific Recap
Asian equity markets followed Wall Street’s lead overnight, pushing higher on the back of positive coronavirus vaccine developments.
Australia’s ASX 200 index rose 0.66%, Hong Kong’s Hang Seng jumped just under 1% and Japan’s Nikkei 225 nudged 0.4% higher.
The haven-associated US Dollar continued to slide lower against its major counterparts while the Japanese Yen clawed back lost ground.
Gold and silver rebounded higher after plunging 4.5% and 6% respectively yesterday, as US 10-year Treasury yields dropped 2 basis points.
Looking ahead, the ZEW Economic Sentiment Index release out of Germany and the Euro-area headlines the economic docket alongside a speech from Federal Reserve Governor Lael Brainard.
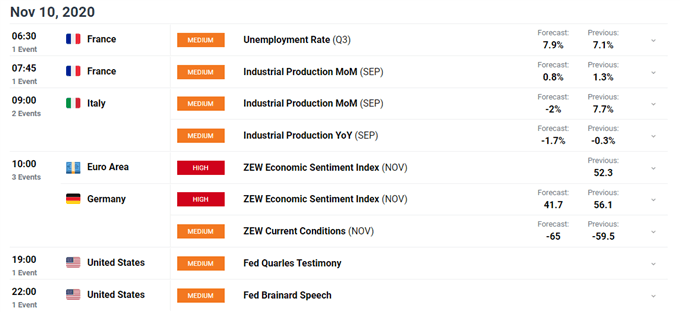
DailyFX Economic Calendar
Vaccine Optimism May Fade as McConnell Tempers Stimulus Hopes
US benchmark indices stormed higher after clinical trial results showed that the vaccine developed by Pfizer and BioNTech proved to be 90% effective in protecting people from the novel coronavirus.
The S&P 500 index surged over 3.2% and the Dow Jones Industrial Average soared 4.86%, as market participants cheered the promising developments.
However, both indices have since retraced much of their respective topside pushes after Senate Majority Leader Mitch McConnell pushed for a “targeted pandemic relief” bill, in light of the positive vaccine developments and the recent drop in the US unemployment rate.
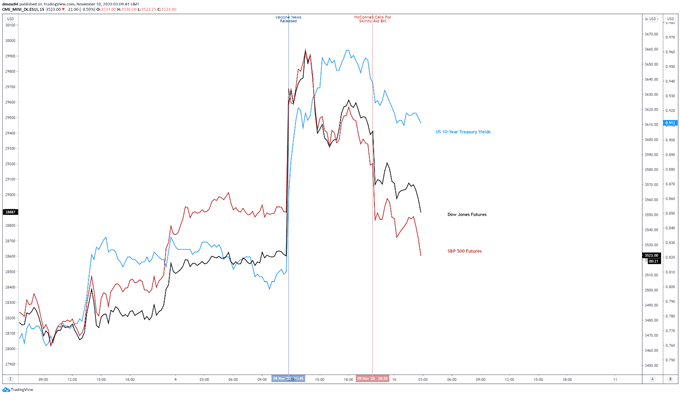
Chart created using TradingView
The unemployment rate declined by a full percentage point to 6.9% in October, drastically exceeding consensus estimates that called for a more modest 0.2% fall.
This market reaction suggests that the size of a much-needed fiscal stimulus package may have a greater impact on near-term price action than vaccine developments.
Indeed, with Pfizer’s initial production capacity for 2020 limited to 50 million doses and the company stating that each dose of the vaccine takes two shots, it appears mass vaccination won’t be possible until mid-2021.
Nevertheless, with the US consistently recording over 100,000 cases of Covid-19 a day, market sentiment may remain positive in the near term as investors begin to see light at the end of the tunnel.
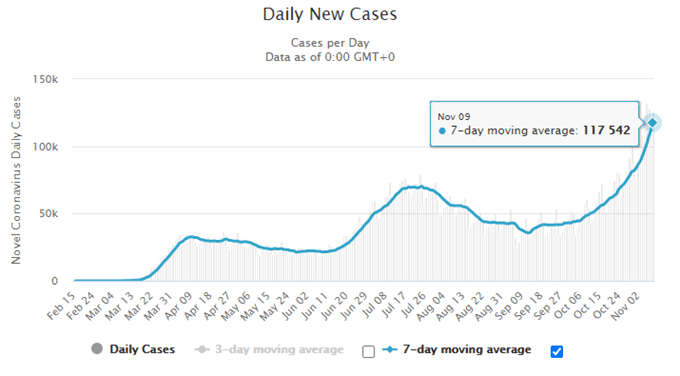
Source - Worldometer
Blue Wave Unlikely, Not Improbable
There is also a distinct possibility that market participants will continue to price in the outside chance of a ‘Blue Wave’ scenario – where Democrats control the White House, Senate and the House – as two of the Senate races in Georgia are pushed to January 5 runoffs.
As it stands, Republicans are expected to retain their majority, which would probably hobble President-elect Biden from moving forward with legislation that doesn’t have GOP buy-in.
In one way this could be market positive, with political gridlock hampering the Biden administration from reversing the Trump tax cuts.

Source – Bloomberg
However, it could also prevent the President-elect from passing an extensive fiscal stimulus package, as Senate Republicans refuse to nudge above $500 billion while Democrats call for closer to $2 trillion.
Therefore, the medium-term outlook for risk-sensitive assets may hinge on who controls the Senate, with a Democratic sweep probably buoying asset prices as investors price in a more substantial fiscal aid package.
S&P 500 Index Futures Daily Chart – Shooting Star Ominous for Bulls
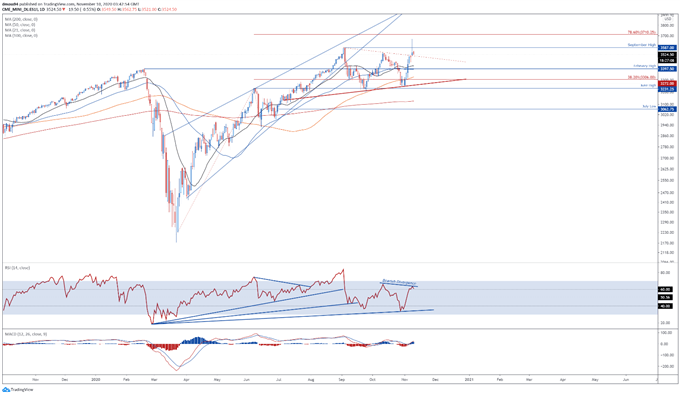
S&P 500 index futures daily chart created using TradingView
From a technical perspective, the benchmark S&P 500 index is at risk of reversing lower after sellers hammered price back below key resistance at the September high (3587), forming a bearish Shooting Star candle just above the psychologically imposing 3500 mark.
The notable flattening of the trend-defining 50-day moving average (3395), in tandem with bearish RSI divergence, suggests the path of least resistance is lower.
A breach of 3500 would probably generate a pullback towards the February high (3397), with a break below carving a path to test the 38.2% Fibonacci (3306).
Conversely, a push to fresh yearly highs could be on the cards if support at the 3500 mark holds firm, with a daily close above the September high (3587) needed to bring the November 9 high (3668) into focus.
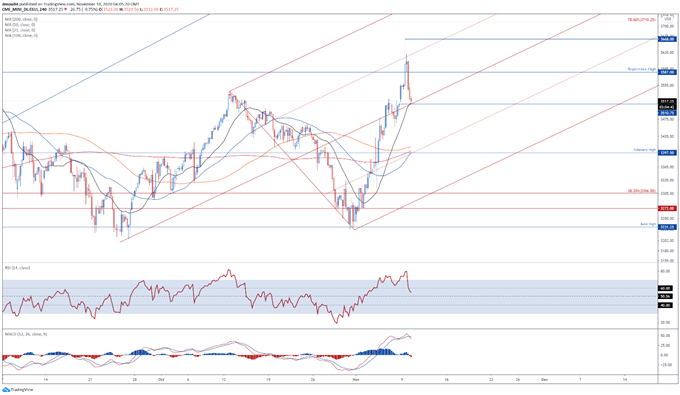
S&P 500 Index Futures 4-Hour Chart – Confluent Support May Inspire Buyers
S&P 500 index futures 4-hour chart created using TradingView
Zooming into a four-hour chart however, suggests that the S&P 500 could rebound higher if price is able to hold above confluent support at the Schiff Pitchfork median and November 6 breakaway gap (3511).
With the downward slope of the RSI notably plateauing, and the 50-MA (3398) and 200-MA (3401) forming a bullish ‘golden cross’ formation, the path of least resistance seems skewed to the topside.
To that end, a retest of the yearly high (3668) may be in the offing if buyers can hurdle resistance at the September high (3587) and would probably bring the 78.6% Fibonacci expansion (3710) into play.
On the other hand, a breach of psychological support at 3500 could generate a pullback towards the November 6 low (3457).
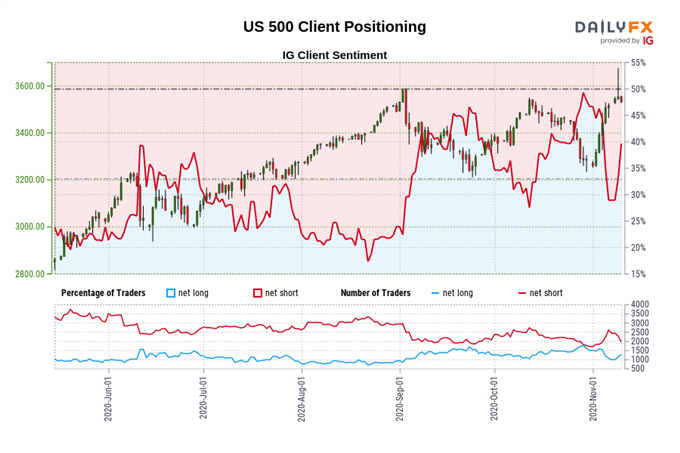
Retail trader data shows 37.64% of traders are net-long with the ratio of traders short to long at 1.66 to 1. The number of traders net-long is 5.44% higher than yesterday and 24.50% lower from last week, while the number of traders net-short is 13.13% lower than yesterday and 9.52% higher from last week.
We typically take a contrarian view to crowd sentiment, and the fact traders are net-short suggests US 500 prices may continue to rise.
Positioning is less net-short than yesterday but more net-short from last week. The combination of current sentiment and recent changes gives us a further mixed US 500 trading bias.
-- Written by Daniel Moss, Analyst for DailyFX
Follow me on Twitter @DanielGMoss

