Nasdaq, S&P 500 Price Analysis:
- US equities have been in the midst of a rip-roaring rally over the past four months, even as a global pandemic rages on with still unknown consequences.
- After a quick scare in February-March, US equities found support and bounced higher, erasing much of the prior losses in the S&P and the entirety of those losses in the Nasdaq 100.
- With Central Bank support as a key component of that theme, the big question is how supportive they may be, near-term, after the S&P jumped by as much as 51.1% and the Nasdaq 100 67% in four months.
- For tomorrow – the S&P 500 is working on a short-term bear flag, and the Nasdaq 100 has made a recent lower-low… could this lead into deeper corrections on US equities?
How Hard Does Powell Want to Push?
After kicking-off Q3 with some pretty considerable momentum, both the S&P 500 and the Nasdaq remain on their back foot ahead of the FOMC rate decision on the calendar for tomorrow. The S&P 500 has jumped by as much as 51.1% from the March lows, while the Nasdaq 100 has shown an astounding run of as much as 67% - or 2/3rds of its value over the same amount of time.
To be sure, the fundamental backdrop has a number of question marks. But, at this point, many of those qualms have been at least somewhat obviated by the hope for continued stimulus out of the US government, causing many traders to chase moves even as higher-highs are made. Given the expectation for rates to remain very low for a very long time, with the potential for even lower Treasury rates in the US, there’s been little attraction to investing in bonds; leaving market participants with a dearth of venues to try to anticipate any future stimulus announcements.
This leaves us in the uncomfortable position of having to rely on governments’ actions to continue driving momentum, and this puts even more importance on an event like tomorrow’s FOMC rate decision where market participants will be parsing paragraphs for any hints or innuendo as to what the Fed may see as pressure points. While its unlikely that the Fed is going to pull away the proverbial punch bowl anytime soon, there’s also the matter of saving bullets for future risks or problems. And the Fed’s take on how quickly global economies may recover has already shown to be of interest: The June FOMC rate decision saw a less upbeat Jerome Powell question the possibility of a v-shaped recovery, and equities sold off for a day in response. But as most sell-offs have been over the past few months, the pullback was shallow and buyers soon returned, helping to continue the up-trend as hopes for more stimulus remained.
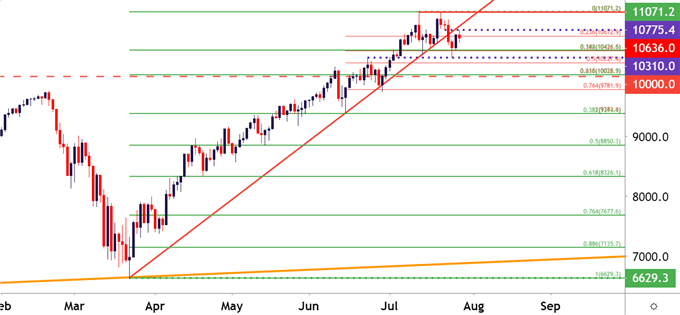
Nasdaq 100 Daily Price Chart

Chart prepared by James Stanley; Nasdaq 100 on Tradingview
Over the past two weeks the bullish theme in the Nasdaq 100 has begun to stall; and given the 67% run that showed in the four months prior, that can make sense. The bigger question is one of reversal or pullback potential, as each such theme has so far been fairly minor and quickly offset by bullish commentary. The current ‘lack of strength’ has allowed for a 14.4% retracement of the March-July move; a level which is confluent with the 38.2% retracement of the shorter-term June-July major move.
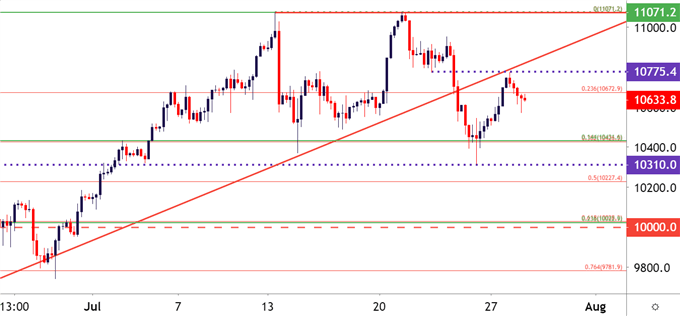
That confluent zone helped to cauterize support after last week’s pullback, with an assist from a prior swing high at 10,310 coming in to set the low. That has since led-in to another bounce; but bulls haven’t yet been able to break up to a higher-high, keeping the door open for a deeper pullback given the recent lower-low from last week.
Nasdaq 100 Four-Hour Price Chart

Chart prepared by James Stanley; Nasdaq 100 on Tradingview
The 10K Level Lurks Below
If the Nasdaq gives up another 600-some points, financial media may lose their minds. But, this is also around an area where longs may become attractive given a couple of different reasons: There’s a confluent zone of Fibonacci levels around this area, specifically around 10,020; and the 10k psychological level brought considerable resistance on the way up but, to date, hasn’t shown much for higher-low support.
S&P 500
The S&P has lagged the Nasdaq in the pandemic backdrop, given that no new all-time-high has yet been set for the broad-based blue-chip index. That’s not to say a strong recovery hasn’t shown, as +50% is nothing to sneeze at; but the Nasdaq run has been more significant in nature and thusly that’s what’s gotten much of the attention.
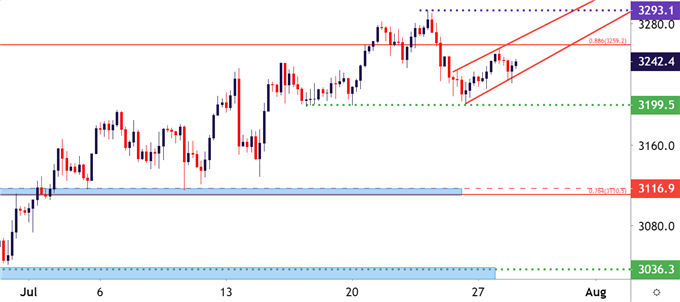
But in the S&P 500 buyers have begun to slow down as prices have approached that all-time-high territory, with bulls getting about 105 handles away last week. That bullish push from last week fell flat, sellers showed up and ended up finishing the week with a net loss in the index.
At this point, the 3200 level has evoked yet another iteration of support. The corresponding bounce has built in a corrective manner, taking on the tone of a bear flag formation. This can keep the door open to deeper correction potential ahead of tomorrow’s FOMC rate decision.
S&P 500 Four-Hour Price Chart

Chart prepared by James Stanley; SPX500 on Tradingview
--- Written by James Stanley, Strategist for DailyFX.com
Contact and follow James on Twitter: @JStanleyFX


