Gold, XAU Price Analysis
- Gold prices have had a tough past ten days, falling from above 1700 down to 1451, totally a loss of almost 15% in less than two weeks.
- While Gold is often considered a safe-haven, in extreme scenarios of panic, cash often takes preference, as has been seen since the seven-year-high was set on March 9th.
- Gold is now nearing a key zone of support. Global governments have launched massive bazookas. Will Gold bulls respond by hitting the bid?
Gold Crushed as Dash for Cash Dominates Global Markets
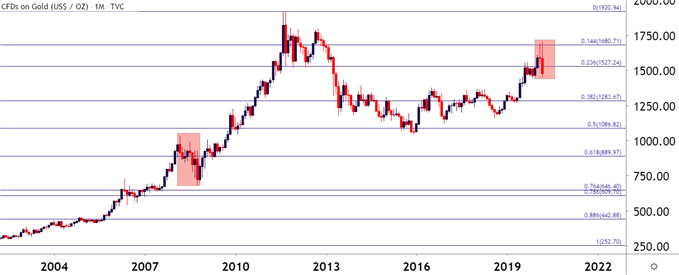
Gold is often considered a safe-haven asset; something that can benefit during times of stress or panic as investors duck for cover. This isn’t always the case, however, as can be evidenced from what took place in March of 2008 into October of the same year. March of 2008, of course, is when Bear Stearns went bankrupt; and this was followed by Lehman in September. Shortly after that, the government got to work with TARP passing through Congress and then the Fed getting to work with QE.
The next three years brought a massive bullish trend as Gold prices moved-up from an October 2008 low of 681.75 up to a 2011 high of 1920. But – when the panic was at its highest, as Bear Stearns and Lehman were getting hit – Gold prices softened by more than 33.9%.
Gold Monthly Price Chart: Nearly 34% Drawdown During Depth of Financial Collapse

Chart prepared by James Stanley; Gold on Tradingview
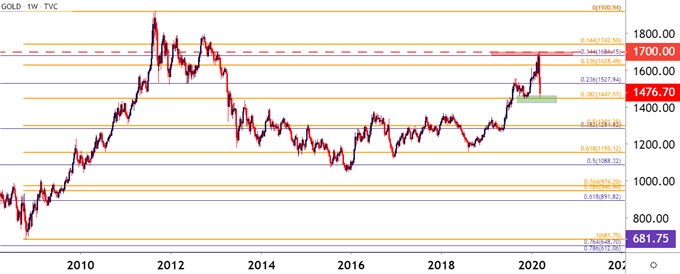
This highlights how deflationary backdrops, particularly panic-prone scenarios can see a flight-to-quality that not only ignores Gold but treats it in a very bearish manner. This would appear to be what’s taken place over the past few week as Gold prices have cratered from a seven-year-high above 1700 to a multi-month low around the 1450 level. Gold prices are fast approaching a batch of support that had come into play of August of last year. This is around the 1447 level, which is the 38.2% retracement of the post-Financial Collapse major move, spanning the 2008 low up to the 2011 high.
Gold Weekly Price Chart

Chart prepared by James Stanley; Gold on Tradingview
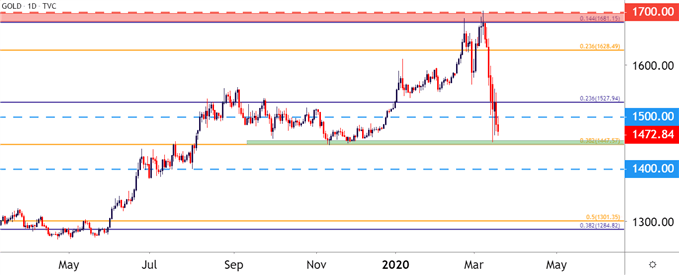
Taking on a shorter-term look at the near-term scenario, and Gold prices have quickly moved from an overbought state to a near-oversold state on the daily chart. And a big difference here from the above mention of 2008: In that prior scenario it took the fall of Lehman to really kick the Federal Government into gear. This time – both Congress and the Fed wasted little time in attempting to address the worry enveloping markets. It just, hasn’t yet ‘worked,’ as was looked at in today’s webinar.
But, aligning the backdrop and considering the compendium of facts can make the long side of Gold as potentially attractive; especially for those that are looking for a bit of pressure release in the US Dollar after a massive run of strength there. This would be a reversal scenario given the gravity of the recent sell-off, so traders would likely want to proceed with caution considering the counter-trend nature of such a setup. Resistance potential exists at the 1500 psychological level followed by the 1528 Fibonacci level. Below current support around the Fibonacci level lodged at 1447.57, deeper support interest may show around the 1400 area, which had previously provided a bit of support as the bullish trend was building in August of last year.
Gold Daily Price Chart

Chart prepared by James Stanley; Gold on Tradingview
--- Written by James Stanley, Strategist for DailyFX.com
Contact and follow James on Twitter: @JStanleyFX

