
Gold, XAU Price Analysis:
- The end of April is fast approaching and headlining this week’s DailyFX economic calendar are the Federal Reserve and the European Central Bank rate decisions. Also – some very big US corporates report earnings this week, adding to the potential for large-scale market movements.
- A major shocked showed across global markets in March, but that’s been offset, to varying degrees, by aggressive Central Bank action.
- Gold prices initially fell by almost -15% in March as that shock was being priced-in; but as volatility calmed bulls came back into Gold to push prices up to fresh seven-year-highs. Will this week’s Fed and ECB meetings serve to continue the highly volatile backdrop in Gold prices?
Gold Prices Digest After 20% Run Leads to Fresh Seven-Year-Highs
Gold prices made another run at fresh seven-year-highs last week; but this time buyers shied away ahead of the re-test at the high watermark. And while bulls haven’t thrown in the towel, the past two weeks have largely been back-and-forth price action as the yellow metal has digested a really strong string of gains that built in the first two weeks of April trade. That impasse may not last for long, however, as this week’s economic calendar is rife with potential, including Central Bank rate decisions from the two largest economies on Earth in the US and Europe, set to take place on Wednesday and Thursday, respectively.
Gold Four-Hour Price Chart
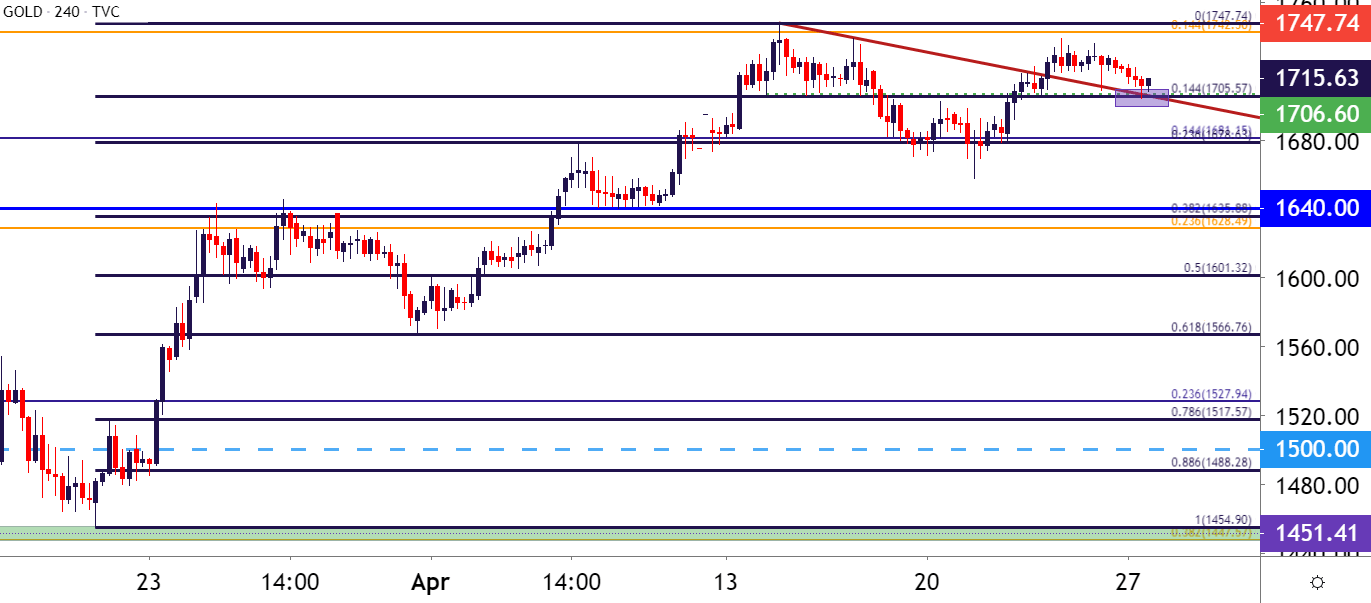
Chart prepared by James Stanley; Gold on Tradingview
Taking a step back, it was the bearish move in mid-March that proved so befuddling. While many often look at gold as a ‘safe haven’ type of asset that can be attractive during a ‘flight to quality,’ gold prices can certainly drop during a cash crunch or when a backdrop of potential deflation presents itself. Similarly, Gold prices dropped by about 34% during the heaviest periods of the Financial Collapse, from March-October of 2008: And in mid-March, as fears and risks from coronavirus-driven shutdowns were getting priced into markets, gold prices dropped by almost 15% in a week.
{{GUIDE| BUILDING_CONFIDENCE_IN_TRADING}}
As noted around that inflection, gold prices encountered a key zone of support in this area that, eventually, helped to cauterize the lows, with price action remaining above the November swing. Since then – it was largely a one-way show from March 20th into April 14th, with price action gaining as much as 20.2% in less than a month’s time.
Gold Eight-Hour Price Chart

Chart prepared by James Stanley; Gold on Tradingview
Gold Near-Term, Ready to Run on Central Bank Drivers
Given the posturing over the past couple of weeks, gold prices can make a big move in a very short period of time, especially given the drivers that await on this week’s economic calendar. The bullish side may remain as attractive given the collection of drivers combined with both recent short and long-term trends. It’s worth mention, however, that we’re still in the early stages of the coronavirus pandemic and governments may need to do even more to stem off the near-certain economic declines that will show through in the data in the coming months. This additional softening or loosening in the both monetary and fiscal backdrops can further contribute to gains in gold prices, but, as was seen by the near -15% decline in a week during March, price movements are unlikely to show in a linear fashion.
From a short-term perspective, gold prices are taking on the shape of an inverted head and shoulders pattern, with a neckline around those prior seven-year-highs. At this point – support is being tested at a confluent area that would constitute the right shoulder of the formation, which is also around the 14.4% retracement of the March-April trend, as well as a trend-line projection taken from swing-highs in mid-April. This can keep the near-term focus on topside breakout potential.
To learn more about the head and shoulders pattern, the newly revamped DailyFX education section looks into this along with a number of other candlestick formations and chart patterns.
DailyFX Education, The Head and Shoulders Pattern
Gold Two-Hour Price Chart
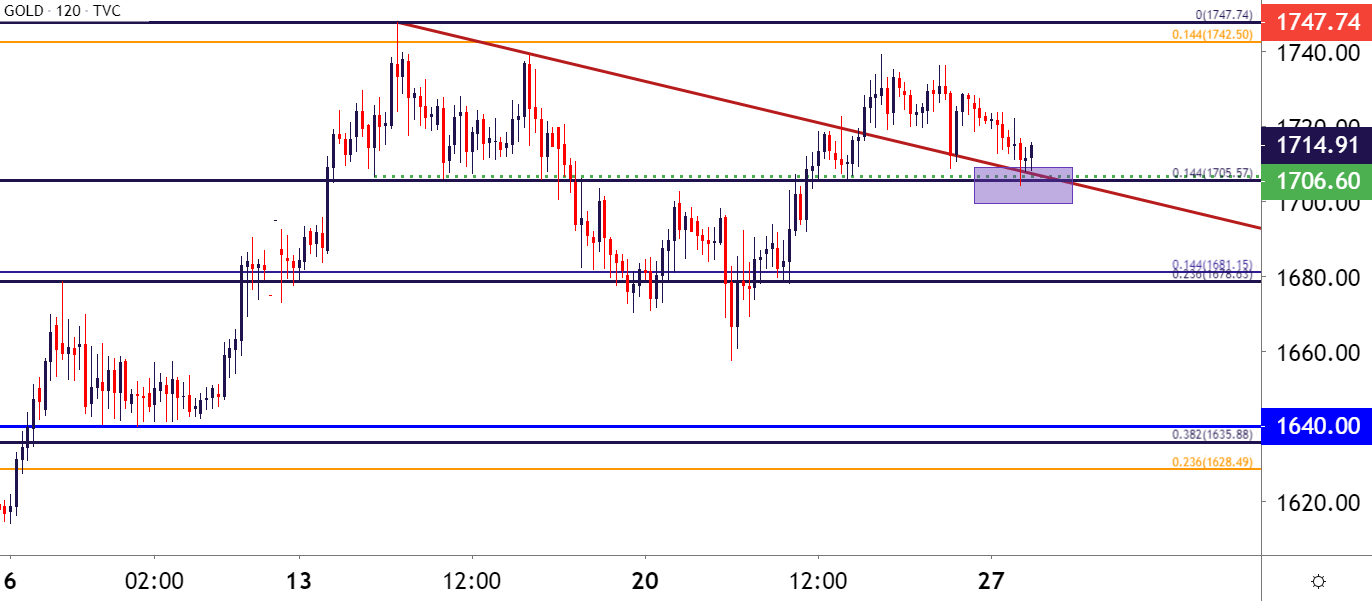
Chart prepared by James Stanley; Gold on Tradingview
--- Written by James Stanley, Strategist for DailyFX.com
Contact and follow James on Twitter: @JStanleyFX