Gold, XAU, GLD Price Analysis
- Gold prices have put in almost three weeks of mean reversion after a 20% leap from March lows up to April highs.
- Will gold bulls jump in to further the trend as price action continues to coil?
- This week’s economic calendar has a few notable items, key of which is the Non-Farm Payrolls report due on Friday morning.
Gold Volatility Calms After 20% Jump
It’s been fits and starts of volatility in Gold prices so far this year, and that can really extend back to Q4 of 2018 as global markets began to show symptoms of being unnerved by a spate of continued rate hikes out of the Federal Reserve.
It may seem like a different reality but it wasn’t even two years ago that the FOMC was wrestling with market expectations around higher rates. While the Fed had already put in three hikes going into Q4 of 2018, markets were apparently looking for some element of pause as the risk trade collapsed very soon after the start of the quarter; with that sell-off continuing into the Christmas holiday. The Fed even hiked in December to mark four rate hikes in 2018; and in the projections shared at that meeting they said that they were even looking at the potential for two more hikes in 2019.
As we all now know, 2019 didn’t happen like that. Instead, shortly after that fourth rate hike in 2018 various members of the FOMC began talking up the potential for rate cuts and that chorus for cuts only grew louder through the early-part of 2019. Normalcy was restored as US equity markets were back on the bid; and Gold prices benefited mightily as buyers were able to press the matter through the first-half of 2019, creating a strong bullish trend that ran well into the summer.
Learn more about the Federal Reserve and their function within the US and global economy as part of the recently revamped DailyFX Education offering.
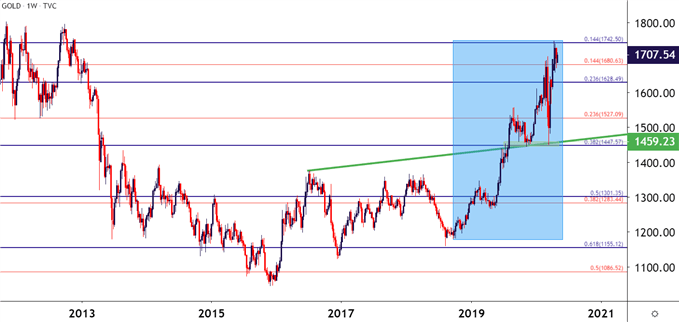
Gold Weekly Price Chart

Chart prepared by James Stanley; Gold on Tradingview
At the core of this drive was the FOMC moving into a more dovish posture and, eventually, cutting rates three times in 2019 versus the two hikes that they had initially projected in December of 2018.
As 2020 has brought an entirely new risk to the table with the novel coronavirus, the Federal Reserve’s stance has been a similar one of accommodation, helping Gold prices to further surge up to fresh seven-year-highs, with a +20% move showing from the March low up to the April high.
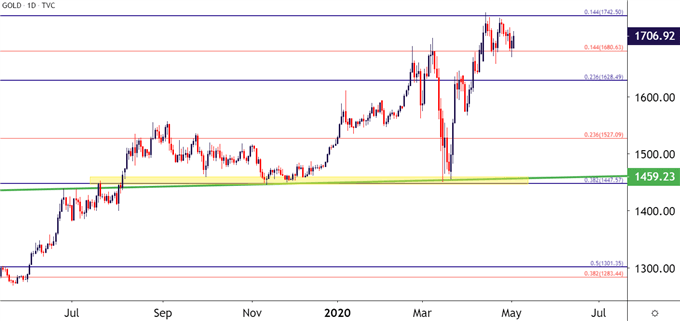
Gold Daily Price Chart

Chart prepared by James Stanley; Gold on Tradingview
Gold Prices – Near-Term
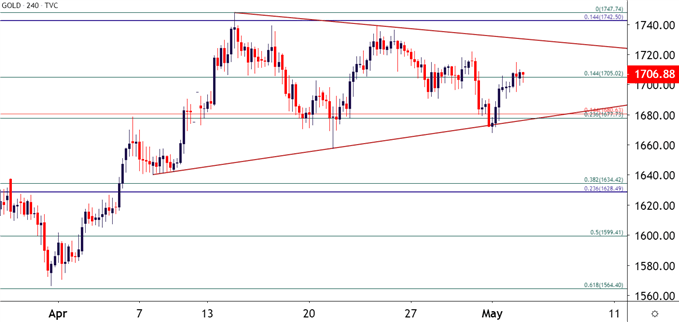
At this point, gold prices have been mean reverting for almost three full weeks following that 20% ramp from the March lows up to the April highs. But, perhaps obscuring that prior bullish theme a bit was the context at the time when it started: Gold prices tanked by almost 15% in a week in mid-March. This highlights just how jumpy markets have been around the pricing-in of fears around the coronavirus. That bearish run appeared to emanate from a cash crunch; and as global Central Banks moved to turn up the accommodation, the bullish trend came back to help Gold trade up to fresh highs.
The big question at this point is one of continuation, and this certainly isn’t the first case of digestion seen in the yellow metal after a really big move in one direction or the other. At this point, that bullish bias may remain as attractive, particularly given the fact that many expect the Fed and global Central Banks to remain as accommodative as necessary to help contain the economic fallout from the coronavirus.
Gold Four Hour Price Chart

Chart prepared by James Stanley; Gold on Tradingview
--- Written by James Stanley, Strategist for DailyFX.com
Contact and follow James on Twitter: @JStanleyFX

