Gold Price Analysis
- Gold prices have set yet another fresh seven-year-high.
- Longer-term, gold prices remain overbought via RSI, creating a conundrum for a fresh bullish breakout.
- Tomorrow brings NFP on the economic calendar, and this will likely be a key data point for directional drives in the days or perhaps even weeks to come.
Gold Breaks Out, Pulls Back, Tests Support at Prior Resistance
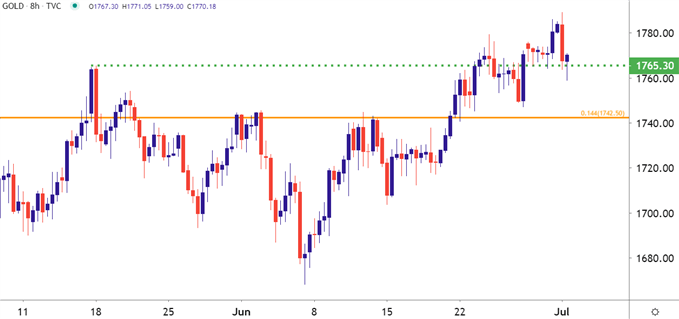
It was a fast start to Q3 for Gold prices as the yellow metal posed a bullish breakout on the final day of Q2, and that continued to run in the overnight session. This helped Gold prices to set a fresh high water mark shortly after midnight eastern time, accounting for a fresh seven-year-high in the precious metal.
Already, that move has pulled back and a bit of support has shown around a prior swing-high, taken from the mid-May run in Gold prices when the yellow metal was bid up to 1765.30. The big question right now is whether this bullish run might have scope for continuation – and the answer to that will likely be at least partly decided by the results of tomorrow’s NFP release.
Gold Eight-Hour Price Chart

Chart prepared by James Stanley; Gold on Tradingview
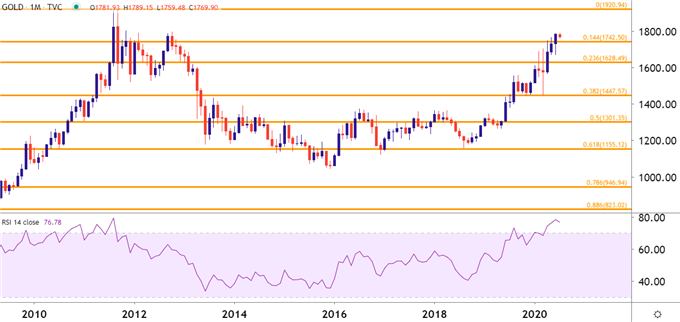
Gold Prices Long-Term: Still Overbought
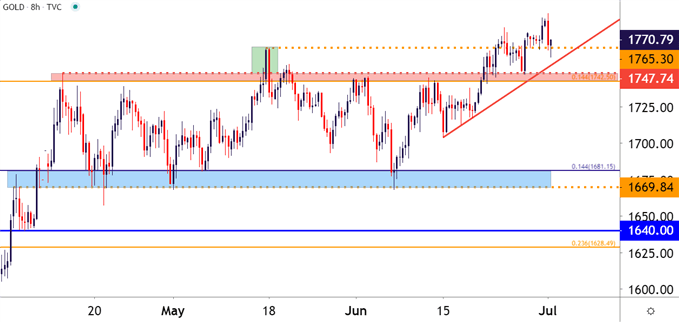
Taking a step back to get some context and Gold prices remain in an overbought state on the monthly chart, largely owed the prolonged up-trend that’s helped to propel prices into this area on the chart. As discussed previously, the 1742.50 level was big, as this is the 14.4% Fibonacci retracement of the post-Financial Collapse move and, for two months, helped to set resistance in Gold. The notable exception during that two-month-range was the high set in mid-May, when Gold prices quickly broke out after the weekly open.
But, as looked previously, that bullish drive was largely emanating from an interview that FOMC Chair Jerome Powell had on the US television program 60 Minutes, in which he said that there was ‘no limit’ to what the Fed could do with the liquidity programs available to them. This breakout-fake out scenario is shown in Green on the below chart, as price action merely reverted right back into the range.
Gold Eight-Hour Price Chart

Chart prepared by James Stanley; Gold on Tradingview
While those pledges have helped to continue driving stock prices higher, it also helped Gold to breakout, albeit temporarily, which is where the 1765 level comes into play; that was the high set shortly after that breakout and, as of this morning, appears to be getting re-purposed as support. But, as seen on the below chart, RSI remains heavily overbought, highlighting the danger of chasing a well-developed trend, even after a fresh seven-year-high has come into the equation.
Gold Monthly Price Chart

Chart prepared by James Stanley; Gold on Tradingview
--- Written by James Stanley, Strategist for DailyFX.com
Contact and follow James on Twitter: @JStanleyFX

