Gold Price Forecast Talking Points:
- After a strong month of December held through the New Year, bears have awoken to re-take control of short-term Gold price action.
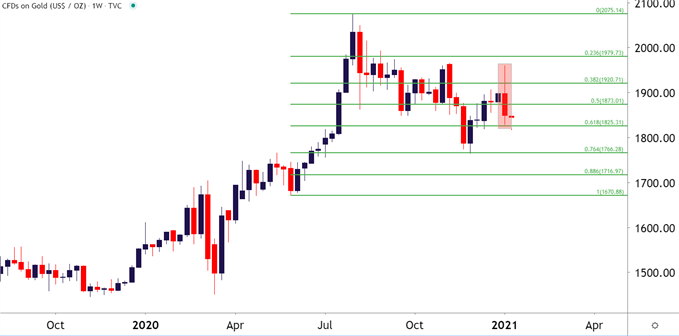
- Gold prices finished last week’s bar with a bearish engulfing pattern, often followed with the aim of continued bearish behavior.
- The analysis contained in article relies on price action and chart formations, along with focus on a couple of different bearish engulfing patterns. To learn more about price action or chart patterns, check out our DailyFX Education section.
Gold prices are starting 2021 on the move, but probably not in the manner that many had expected. As the US Dollar continues to pullback, Gold prices have been offered aggressively over the past few trading days as the yellow metal has pushed down to a fresh monthly low.
As looked at in this week’s technical forecast, the first weekly bar in Gold for 2021 printed as a bearish engulfing formation, which will often be approached with the aim of bearish continuation. This is similar to the formation that showed on the Daily chart back on August 7th, the same date that Gold set its current all-time-high. In that scenario, the bearish engulf highlighted the potential for the start of a pullback but, now five full months later Gold bulls remain subdued.
The bearish engulfing formation that printed last week brings on the prospect of fresh lows in Gold prices, with focus on the late-November swing around 1764.
To learn more about bearish engulfing patterns and why traders will often follow the formations for continuation, join us in DailyFX Education
Gold Weekly Price Chart

Chart prepared by James Stanley; Gold on Tradingview
Gold Holding at a Confluent Support Level
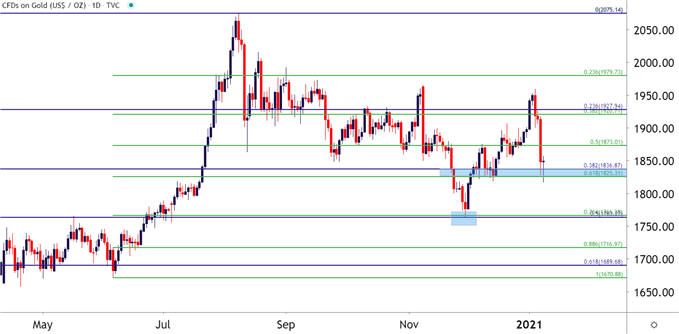
That November low printed at a key area on the chart as there are two levels derived from two separate 2020 major moves that helped to bring buyers back into the fray. At 1763.27 we have the 50% marker from the March-August major move, and at 1766.28 we have the 76.4% retracement of the June-August major move.
Each of these Fibonacci studies have nearby levels, as well, with the 38.2% retracement of the March-August move plotting at 1836.87 and the 61.8% retracement of the June-August move at 1825. The big question is whether this can bring enough buyer support in the matter to turn-around last week’s declines and, at this stage, there would appear a lack of supporting evidence to get too excited about the bullish side just yet.
Gold Daily Price Chart

Chart prepared by James Stanley; Gold on Tradingview
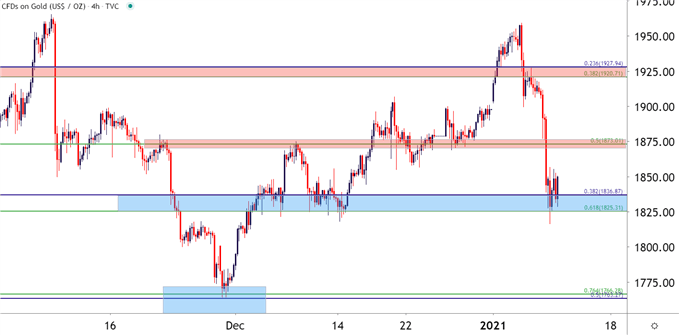
Taking an even shorter-term look at the matter, and the importance of the Fibonacci retracement derived from the June-August move becomes a bit more clear. Those levels are outlined in Green on the above and below chart, and the 61.8% retracement at 1825 has so far helped to cauterize this week’s lows. It also appears that buyers might step up here, but given the recent short-term bearish trend, this would likely be considered corrective.
This opens the door for resistance potential around the 1873 level, which is the 50% marker from the June-August major move.
Gold Four-Hour Price Chart

Chart prepared by James Stanley; Gold on Tradingview
--- Written by James Stanley, Strategist for DailyFX.com
Contact and follow James on Twitter: @JStanleyFX


