Gold Price Forecast:
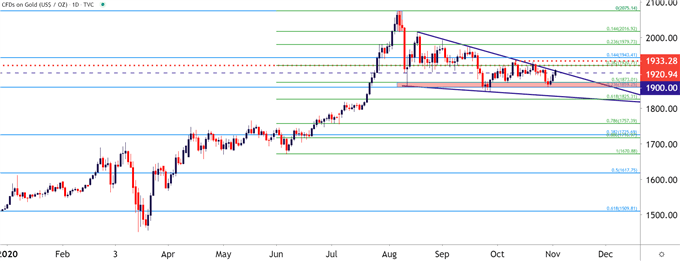
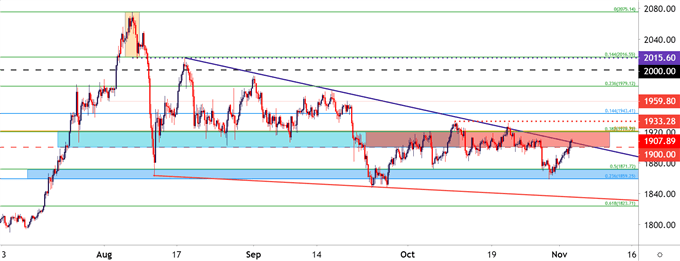
- Gold Prices are testing trendline resistance, threatening to breakout of a falling wedge pattern that’s been building for the better part of the past four months.
- Heavy resistance looms 1900-1920, can buyers finally leave it behind?
- While much attention is focused on the US election, the rest of the week brings heavy potential for volatility with Thursday’s FOMC rate decision and Friday’s NFP.
- The analysis contained in article relies on price action and chart formations. To learn more about price action or chart patterns, check out our DailyFX Education section.
It’s now almost four months ago that Gold prices had topped-out, which might be hard to believe given just how loud that move had become. While bears were tough to find back in early-August, the backdrop has shifted in the almost four months since as Gold prices have continued to coil in a falling wedge pattern after setting that fresh all-time-high.
As looked at then, Friday August 7th closed with Gold prices showing a bearish engulfing pattern. And, at the time, it merely looked as though this may prelude a quick pullback before continuing higher; but that’s not what ended up playing out as we’re now going on four months of digestion in Gold prices after that exuberant bullish trend drove for the bulk of this summer.
Gold Daily Price Chart

Chart prepared by James Stanley; Gold on Tradingview
As noted a couple of times already, the past few months of digestion in Gold prices has taken on the tone of a falling wedge formation. Such formations will often be approached with the aim of bullish breakouts, and often will show-up around an area of key support.
Making matters even more interesting is the fact that this falling wedge is taking on similar tones of a bull flag formation, in which an orderly case of digestion shows after a strong bullish move. Those backdrops will often be approached with the aim of bullish continuation, giving another possible motivator to following the topside of Gold and, more to the point, following for the potential of a bullish breakout here.
To learn more about falling wedges or bull flags, check out our DailyFX Education section.
Gold Four-Hour Price Chart

Chart prepared by James Stanley; Gold on Tradingview
The Calendar is Chaos – Plan as Such
So tonight’s Presidential Election is lining up to be pretty pensive, but no surprise there. The bigger issue is whether or not we actually find out the winner tonight, or whether we’re looking at a prolonged vote count or court cases: All possible outlier events that unfortunately cannot be ruled out. But, even beyond the election, this week’s economic calendar is loaded and there’s a number of other drivers that can push both the US Dollar and Gold prices.
Markets, in general, abhor uncertainty, and that may actually play into bulls’ favor given the economic calendar over the next few days.
On the resistance side, above the 1920 marker that formerly set the all-time-high, the level of 1933 remains of interest, after which 1943, 1960 and 1979 become of interest. If Gold prices moves above all of those prices, the next big spot on the chart is the 2k psych level.
Underneath price action – 1900 remains nearby and below that the same zone that caught the lows last week comes into the picture, running from 1859-1873.
--- Written by James Stanley, Strategist for DailyFX.com
Contact and follow James on Twitter: @JStanleyFX


