Euro Open, EUR/SEK, EUR/NOK, EUR/CAD – Talking Points:
- EUR/SEK looks poised for further declines after breaching long-term trend support
- EUR/NOK may climb higher as it finds support above the 200-day moving average
- EUR/CAD eyeing fresh monthly highs as RSI surges towards overbought territory.
Asia-Pacific Recap

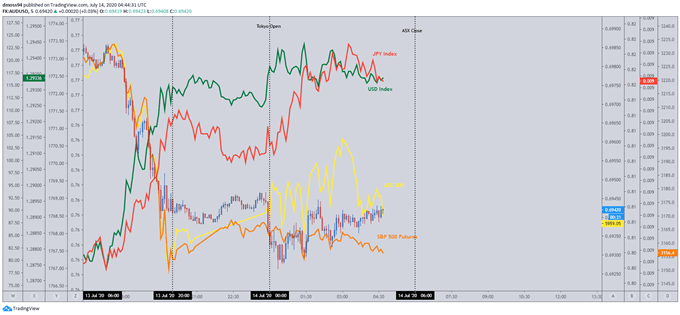
Risk appetite remained absent throughout Asia-Pacific trade as coronavirus concerns and escalating US-Sino tensions notably weighed on investor sentiment.
S&P 500 futures continued to nudge lower after the Trump administration openly rejected Beijing’s claims in the South China Sea and Governor Gavin Newsom halted the easing of coronavirus restrictions in California, in light of a sustained surge in new cases.
The trade-sensitive Australian Dollar held its ground against its major counterparts despite a further 270 new cases of Covid-19 being recorded in Victoria, Australia’s second most populous state.
Looking ahead, a multitude of economic releases out of the UK headline the economic docket ahead of the beginning of the US earnings season for the banking sector, with the likes of JPMorgan, Bank of America and Wells Fargo are all due to report Q2 results.
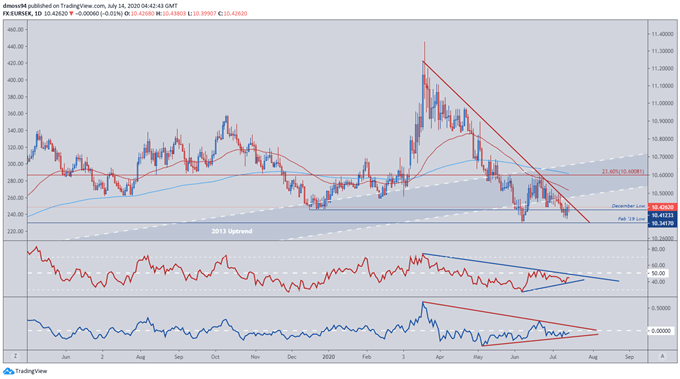
EUR/SEK Daily Chart – Break of Long-Term Uptrend Signals Further Declines

EUR/SEK daily chart created using TradingView
The path of least resistance for the EUR/SEK exchange rate seems to be lower, as price continues its decline towards the June low (10.3417).
With price remaining capped by the 12-week downtrend and the gradient of the 50-day moving average (10.5178) notably steepening, a push to fresh yearly lows looks likely.
A daily close below the June low (10.3417) is needed to validate bearish potential and could lead to a sustained decline back to the 2019 low (10.1553).
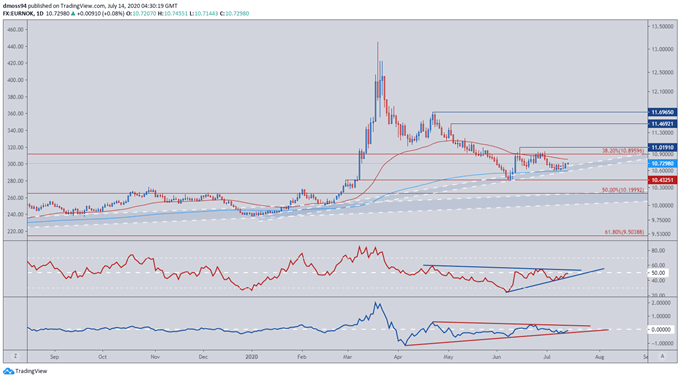
EUR/NOK Daily Chart – Support at 200-DMA may Fuel Recovery

EUR/NOK daily chart created using TradingView
The EUR/NOK exchange rate looks poised to move higher after bouncing off support at the 200-day moving average.
A push back to last month’s high (11.0191) looks on the cards as both the RSI and Momentum indicator continue to track their respective bullish trends.
A daily close above resistance at the June high (11.0191) may encourage Euro bulls and carve a path for price to continue the primary uptrend, with key regions of interest falling at the May (11.4692) and April high (11.6965).
Conversely, a continued decline may eventuate should EUR/CAD slice through support at the 200-DMA, possibly driving price back to the February high (10.4325)
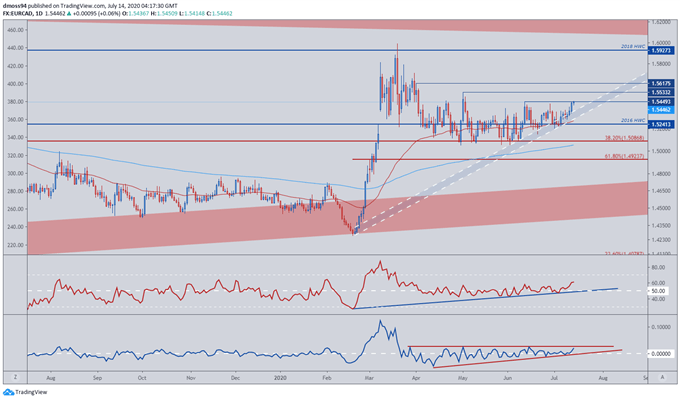
EUR/CAD Daily Chart – Eyeing Fresh Monthly Highs

EUR/CAD daily chart created using TradingView
After finding support at the 50-DMA (1.5270) EUR/CAD has surged to fresh monthly highs and looks set to continue its climb higher, eyeing a potential retest of the April high (1.5617).
Development of the RSI and Momentum indicator hint at a resumption of the primary uptrend as both oscillators soar into bullish territory, possibly stoking further buying pressure.
A daily close above the June high (1.5449) is needed to carve a path back to psychological resistance at the 1.56 level, with a surge through resistance at the April high (1.5617) probably coinciding with the RSI jumping into overbought territory.
On the other hand, inability to break above the 1.55 level hints at a short-term decline back to the 50-DMA (1.5270) and 2016 high weekly close (1.5241)
-- Written by Daniel Moss, Analyst for DailyFX
Follow me on Twitter @DanielGMoss

