EU Stoxx 50, EUR/GBP, EUR/NZD, European Union, Euro Open – Talking Points:
- EU Stoxx 50 capped by 200-DMA as market participants eye stimulus talks
- EUR/GBP perched at channel support, poised to move higher?
- EUR/NZD potential Double Bottom could lead to a reversal of the 14-week downtrend
Asia-Pacific Recap
A broad risk-on tilt was seen throughout the Asia-Pacific session as Chinese equities surged to the highest levels in 12 years.
The FTSE China A50’s jump above the pivotal 15,000 level seemed to fuel global risk assets with the haven-associated Japanese Yen and US Dollar notably declining.
The trade-sensitive Australian Dollar pushed to fresh monthly highs despite Covid-19 cases continuing to climb in Victoria, resulting in the reimposition of border restrictions and lockdown measures.
Looking ahead, Eurozone construction PMI and retail sales releases headline the economic docket with expectations of a record rebound in consumer spending.
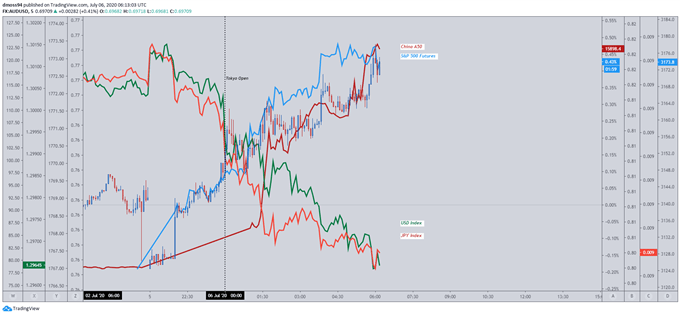
Market reaction chart created using TradingView
Special Summit to Determine EU Stimulus Package
The European Union’s ‘special summit’ in Brussels on July 17 will be intently watched by market participants, with the 27-member nations set to discuss the bloc’s 2021-2027 budget and coronavirus recovery plans.
Considering the depth of the economic recession in Europe the possibility of the provision of a further €750 billion in stimulus has notably buoyed regional equity markets with the Euro Stoxx 50 index recovering as much as 47% from the yearly low.
However, there remain some significant sticking points to the deliberations as the planned distribution of 500 billion in grants and 250 billion in loans continues to be contested by the ‘frugal’ northern nations.
Favouring a reduction in the provision of grants, European Council President Charles Michel is expected to offer a rebate to the wealthier nations, limiting their overall contribution to the budget as a way to garner their support for the much-needed package.
With that said, it is yet to be seen how other nations will take to this favorable concession by the Council. "Not well" seems like a rational expectation.
To that end, inability to get a deal across the line may dampen the outlook for regional equities and may intensify declines should upcoming economic data reflect a sluggish recovery.
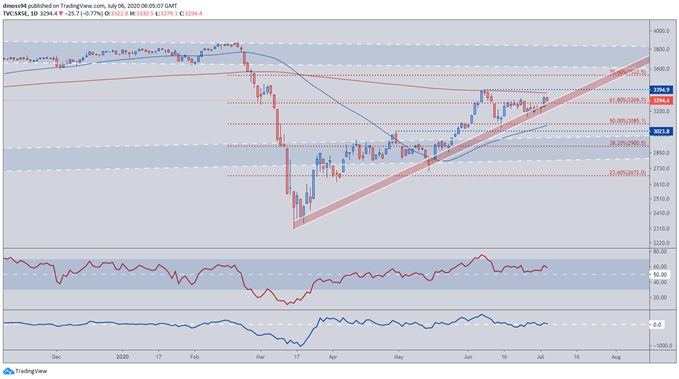
EU Stoxx 50 Index Daily Chart – 200-DMA Continuing to Cap Upside Potential
EU Stoxx 50 index daily chart created using TradingView
The 200-day moving average (3,369) continues to stifle bulls as the European benchmark stalls just shy of the June high (3,395).
Fading strength on the RSI and Momentum indicators signal exhaustion in the most recent rally from the 50% Fibonacci (3,085) with price perched precariously at the 61.8% Fibonacci (3,270) and uptrend support.
Inability to break resistance at the June high (3,395) may trigger a sharp decline in the EU Stoxx 50 index with a daily close below the psychologically pivotal 3,200 level potentially carving a path back to April high (3,024).
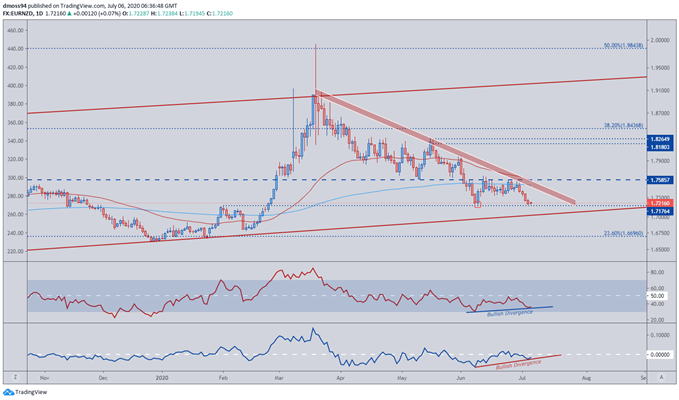
EUR/NZD Daily Chart – Double Bottom in Play as Divergence Hints at Reversal
EUR/NZD daily chart created using TradingView
From a technical perspective, the Euro seems poised to reverse its 3-month decline against the New Zealand Dollar as price carves out a potential Double Bottom at the January high (1.7176).
After a steady 14% decline from the yearly high set in March (1.9927), buying pressure surged at what proved to be the June low (1.7176), fueling a climb back to resistance at the 200-day moving average (1.7510).
The swift rejection of the RSI at its midpoint ignited selling pressure, pushing the EUR/NZD exchange rate back to support at the previous month’s low and potentially setting up a Double Bottom reversal pattern.
A potential break to the upside looks to be on the cards as both the RSI and Momentum indicators fail to confirm the recent 5-day decline – classified as bullish divergence.
Although the development of the 50-DMA (1.7596) could set up a potential bearish cross-over, the sharpness of its decline has notably faded in recent days.
To that end, EUR/NZD may push to retest 200-DMA resistance (1.7503) and could lead to the resumption of the longer-term 5-year uptrend should price clear the 12-week downtrend from the yearly highs andthe May low (1.7601).
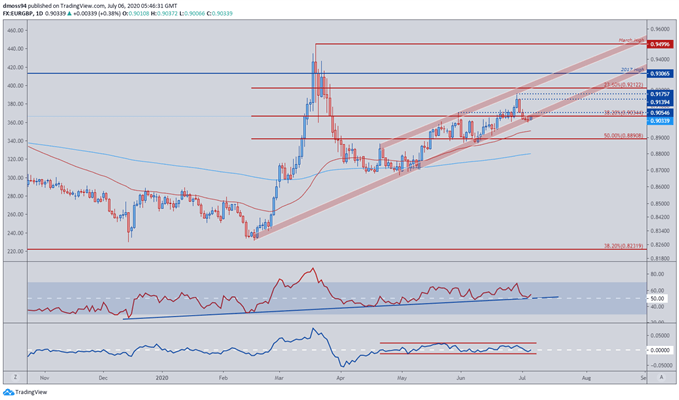
EUR/GBP Daily Chart – Channel Support May Stoke EUR Bulls
EUR/GBP daily chart created using TradingView
Fundamentals aside, the Euro looks set to continue its trek higher as price remains constructively perched a top the uptrend extending from the February low (0.8282).
The development of the RSI may also encourage bulls as it strengthens to the upside, maintaining the uptrend extending from the December extremes.
A daily close above the May high (0.9055) may signal the resumption of the primary uptrend, with a break above the June high (0.9176) potentially igniting a push to test the 2017 high (0.9306).
On the other hand, a break of channel support could see a sharp decline to the 50-DMA (0.8945) and 50% Fibonacci (0.8891).
-- Written by Daniel Moss, Analyst for DailyFX
Follow me on Twitter @DanielGMoss


