EUR/USD, European Central Bank, Euro-zone Inflation, Covid-19 Second Wave – Talking Points:
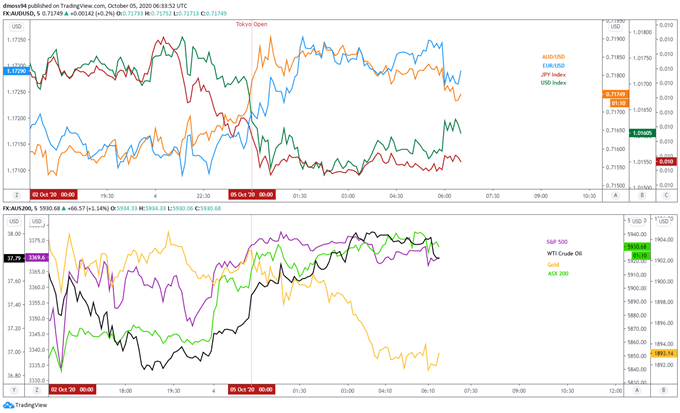
- Equity markets moved broadly higher during the Asian trading session as investors’ mulled President Donald Trump’s coronavirus diagnosis.
- Subdued inflation could sway the ECB to act in the near-term, after Lagarde hints at AIT.
- EUR/USD rates validating bearish reversal pattern. Could price extend its retreat from the yearly high?
Asia-Pacific Recap
Risk appetite appeared to firm during Asia-Pacific trade as investors’ digested news that President Donald Trump may be able to return to the White House after being hospitalized late last week with Covid-19.
Australia’s ASX 200 index surged over 2.5% on the back of the Federal Government’s announced $7.5 billion in additional infrastructure spending.
The haven-associated US Dollar and Japanese Yen lost ground against their major counterparts, while the risk-sensitive Australian Dollar nudged higher.
Gold dipped towards the $1,890/oz mark as yields on US 10-year Treasuries bounced back above 70 basis points.
Looking ahead, speeches from several members of the Federal Reserve headline the economic docket alongside ISM non-manufacturing data for September.

Market reaction chart created using TradingView
Deflationary Pressures May Sway ECB, Weigh on Euro
As mentioned in previous reports, inflation data for September could put further pressure on the European Central Bank to do more to support the trading bloc’s nascent economic recovery, as headline inflation is expected to sink to -0.3% and the core inflation rate to drop to a record low of 0.2%.
Of course, some of the recent weakness in consumer prices can be attributed to the delay in summer sales and marked depreciation in energy prices. Nevertheless, a ‘second wave’ of Covid-19 infections in tandem with a relatively strong exchange rate may continue to subdue Euro-zone inflation in the near-term.
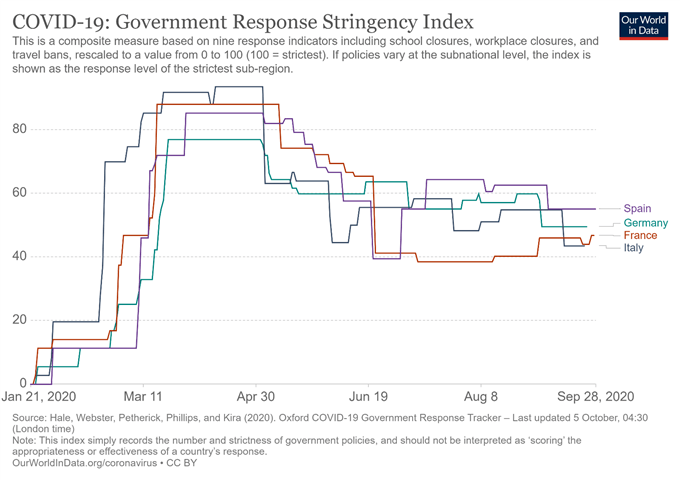
The University of Oxford’s Government Response Stringency Index highlights the impact of a relentless surge of coronavirus infections in France, as the local government begins to tighten restrictions and plans to shut down bars in the capital city of Paris.

In fact, sluggish consumer price growth appears to be behind Christine Lagarde’s comments suggesting that the central bank may adopt a flexible form of average inflation targeting (AIT), with the ECB President stating the “the wider discussion today is whether central banks should commit to explicitly make up for inflation misses when they have spent quite some time below their inflation goals”.
Lagarde added that if AIT proves to be a credible strategy it could serve to “strengthen the capacity of monetary policy to stabilise the economy when faced with the lower bound because the promise of inflation overshooting raises inflation expectations and therefore lowers real interest rates”.
To that end, a slew of ECB speakers scheduled for the week ahead could provide further clarity to President Lagarde’s comments and may weigh on the performance of the Euro against its major counterparts, with a unified view on the provision of additional monetary stimulus probably dragging on EUR/USD rates.

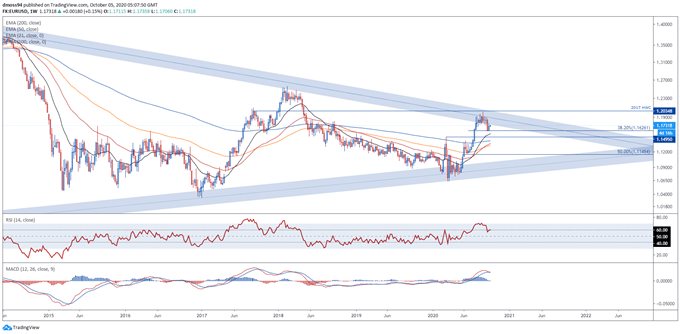
EUR/USD Weekly Chart – 2008 Downtrend Holding Firm

EUR/USD weekly chart created using TradingView
From a technical perspective, the EUR/USD exchange rate seems poised to extend its retreat from the yearly high set in August (1.2011), as price fails to break above its 12-year downtrend and the RSI swerves away from overbought territory.
Moreover, with the 50- and 100-day moving averages tracking below their sentiment-defining 200-period counterpart, and a bearish crossover taking place on the MACD indicator, the path of least resistance seems skewed to the downside.
Extended declines could be in the offing if buyers fail to push price back above the psychologically imposing 1.18 level, with a break back below the 38.2% Fibonacci (1.1626) needed to carve a path back to test the March high (1.1495).
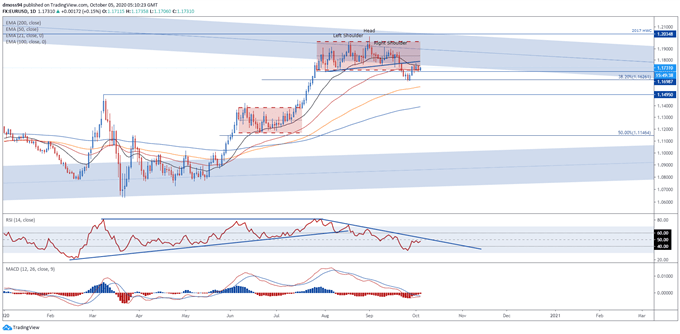
EUR/USD Daily Chart – 21-DMA Capping Bullish Momentum

EUR/USD daily chart created using TradingView
Zooming into a daily chart reinforces the bearish outlook depicted on the weekly timeframe, as price fails to push back above the neckline of the bearish Head and Shoulders reversal pattern it carved out just shy of the 1.20 mark.
Indeed, the recent rebound from the September low (1.1612) appears to have validated the downside break of the bearish reversal pattern and suggests that price could push to fresh multi-month lows in the coming weeks.
Moreover, the development of the RSI and MACD indicators hint at swelling downside momentum, as both oscillators continue to track below their respective neutral midpoints.
Therefore, a daily close back below the trend-defining 50-DMA (1.1714) could trigger a wave of selling pressure and signal the resumption of the 5-week downtrend, with the implied measured move suggesting that price could retest key support at the March high (1.1495).
-- Written by Daniel Moss, Analyst for DailyFX
Follow me on Twitter @DanielGMoss

