EU Stoxx 50 Index, DAX 30 Index, VDAX, Covid-19 Restrictions – Talking Points:
- The Japanese Yen soared during Asia-Pacific trade as Prime Minister Shinzo Abe announced his resignation
- Climbing Covid-19 cases in several European nations threaten to trigger a surge in volatility
- EU Stoxx 50 staggering higher as it tracks in an Ascending Triangle Pattern
- DAX 30 index stalling at key resistance as volume fails to confirm the recent upside push. Could a near-term correction be on the cards?
Asia-Pacific Recap
The Japanese Yen surged late in Asia-Pacific trade after it was reported that Prime Minister Shinzo Abe would announce his resignation due to health issues. Japan’s Nikkei 225 index fell as much as 1.4%, dragging the Australian ASX 200 along for the ride.
S&P 500 futures continued to track higher, buoyed by Federal Reserve Chair Jerome Powell’s speech reiterating that accommodative monetary policy measures are here to stay for the foreseeable future.
The haven-associated US Dollar extended its declines against its major counterparts, as the risk-sensitive Australian Dollar jumped to fresh yearly highs.
Looking ahead, Canadian second quarter GDP headlines the economic docket alongside US personal income data for July.
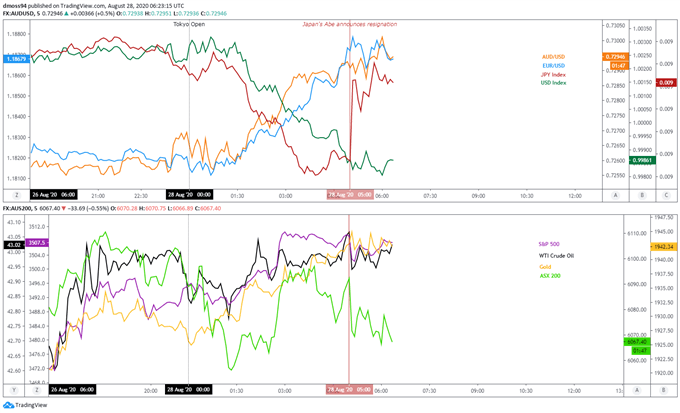
Market reaction chart create using TradingView
Rising Volatility may Weigh on European Equities
Rising numbers of coronavirus infections in Germany, Spain, Italy and France could trigger a surge of volatility and significantly hamper the performance of regional risk assets in the near term.
The impact of the recent rise in cases is immediately reflected in the University of Oxford’s Government Response Stringency Index, with a noticeable tightening of restrictions seen in Italy, Germany and Spain this month.
Surprisingly, the French government has opted to keep measures relatively steady despite recording the largest daily increase in cases since late March yesterday, as Prime Minister Jean Castex stated that he wants to avoid the implementation of a national lockdown.
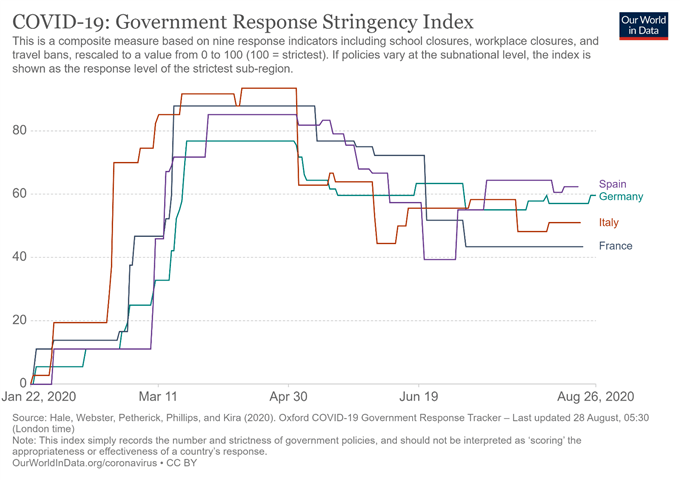
However, the reimposition of growth-hampering restrictions may be necessary if the number of infections continue to climb and could in turn lead to a period of sustained risk aversion.
In fact, the VDAX – the DAX 30 Volatility Index – has yet to fill-in February’s breakaway gap despite relatively positive economic data in the month of August, suggesting a creeping sense of uncertainty among German equity investors.
Euro-area manufacturing PMI expanded for the second consecutive month whilst Germany’s lfo Business Climate indicator climbed to its highest levels since February.
To that end, regional asset prices may come under pressure in the coming weeks, if local health outcomes necessitate the tightening of restrictions and the VDAX index begins to markedly turn higher from the February gap open (22.8891).
VDAX Daily Chart
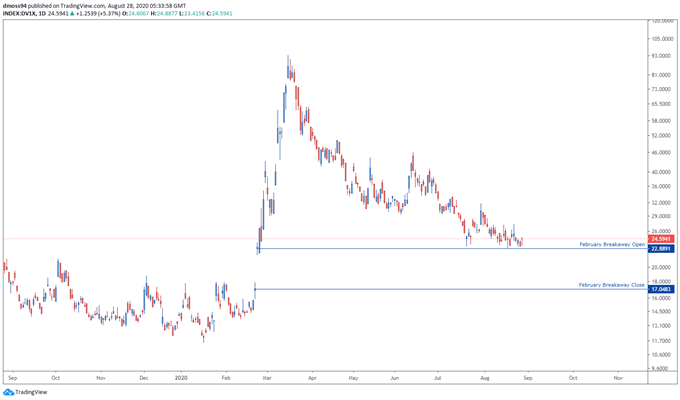
VDAX daily chart created using TradingView
DAX 30 Index Daily Chart – Staggering Towards Record Highs
Germany’s DAX 30 index continues to track within the confines of an Ascending Channel and appears set to push back to the February record high after surging away from mobile support at the 21-day moving average (12840) on August 24.
However, volume has notably faded throughout the German benchmark’s rally from the monthly low (12273.6) and could be indicative of fading bullish momentum as price approaches key resistance at the July high (13315.6).
A correction back towards channel support looks more than likely if price fails to push to fresh post-crisis highs, with trend-defining support at the 50-DMA (12734) and August 21 swing-low (12630) potentially limiting the magnitude of the correction.
Conversely, a daily close above the July high (13315.6) could signal the resumption of the primary uptrend and bring the February high (13828.8) into focus.
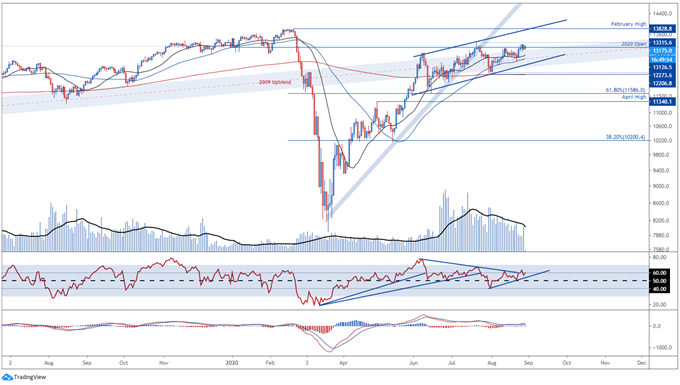
DAX 30 Index daily chart created using TradingView
EU Stoxx 50 Index Daily Chart – Moving Averages Directing Price Higher
Although the EU Stoxx 50 index appears to be carving out an Ascending Triangle pattern just shy of key resistance at the March high (3467), the RSI remains encapsulated by its 8-week downtrend.
This hints at fading bullish momentum and could encourage would-be sellers if price is unable to break above the June high (3394).
Furthermore, the slope of the 21-, 50- and 200-day moving averages have significantly plateaued in August, reinforcing the bearish outlook seen in recent price action.
With that in mind, a short-term pull back to confluent support at the 61.8% Fibonacci (3243) and Ascending Triangle hypotenuse may be on the cards, with a daily close below the 3200 level probably igniting a more significant sell-off and bringing the 38.2% Fibonacci (3063) into focus.
On the other hand, a daily close above the March high (3467) could validate a breakout of Ascending Triangle consolidation and potentially generate an impulsive surge to test the record high set in February (3868).
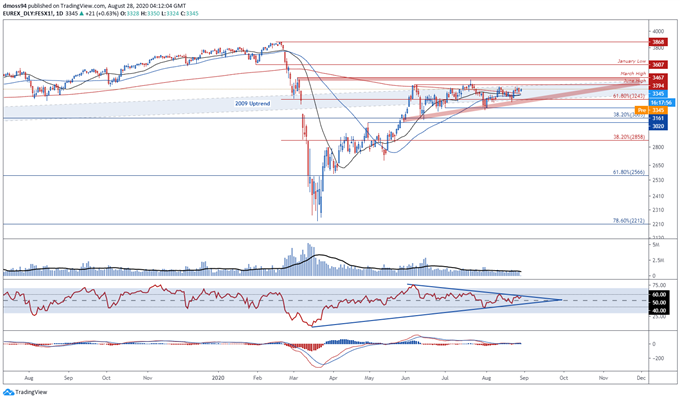
EU Stoxx 50 index daily chart created using TradingView
-- Written by Daniel Moss, Analyst for DailyFX
Follow me on Twitter @DanielGMoss

