Dow, S&P, US Treasuries Price Analysis
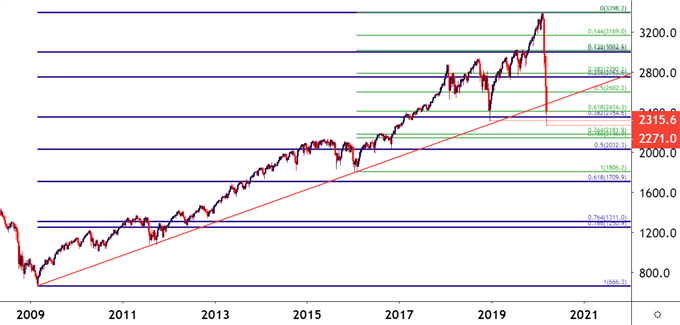
- The S&P 500 is now off by 30.5% from the all-time-high, set less than a month ago.
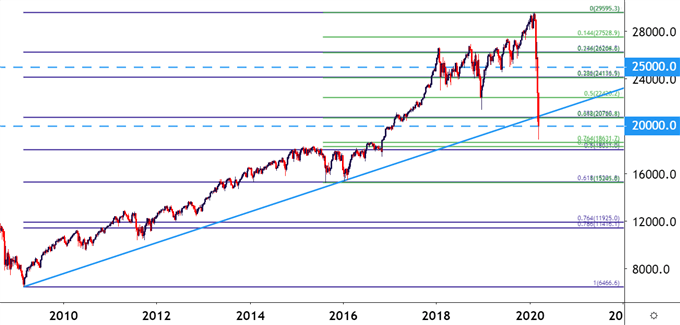
- The Dow Jones Industrial Average crossed-below the 20k marker. Just a month ago the banter was about when the Dow would cross 30k. Few would expect that 20k would show up before 30k.
- Volatility hasn’t been relegated to the stock market, as extreme moves have shown in US Treasuries as the world wrestles with still-unknown fallout from the continued spread of the novel coronavirus.
S&P 500, from Top Down
It was less than a month ago that the S&P marched up to a fresh all-time-high. The Dow Jones was crawling closer to the 30k level, and the question at the time wasn’t ‘if’ but ‘when’ the Dow would hit that new psychological watermark. A month later and, well, charts speak louder than words.
S&P 500 Weekly Price Chart

Chart prepared by James Stanley; SPX500 on Tradingview
Today the S&P 500 sold off yet again, breaking below a number of supports in the process and, as of today’s US equity close – the index is now off a whopping 30.5% from the high set on February 19th. Today marks a fresh three-year-low in the index a mere 20 days after setting an all-time-high. Remarkable.
Elsewhere - the Dow Jones Industrial Average has lost 32% since topping out in mid-February, highlighting outsized losses seen in blue chip companies like Boeing, who is now beset by not only issues around the 737 max but the airline industry as a whole. The big item in the headlines today is the Dow re-crossing the 20k marker. But the 32% drawdown in a little over a month is also noteworthy.
Dow Jones Weekly Price Chart

Chart prepared by James Stanley; Dow Jones on Tradingview
And its not just stocks where extreme moves are showing, as US Treasuries have been on a wild ride, taking on a closer resemblance to bitcoin or some random cryptocurrency rather than the stalwart of global sovereign bonds that it has always been.
Treasuries are like a baseline for the global financial system. US Treasuries are some of the largest debentures that aren’t currently trading at negative rates, as ‘pedal-to-the-floor’ emergency accommodation in Europe and Japan have driven both German and Japanese debt into negative territory.
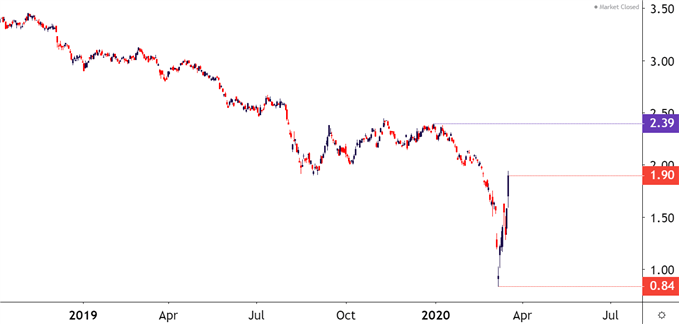
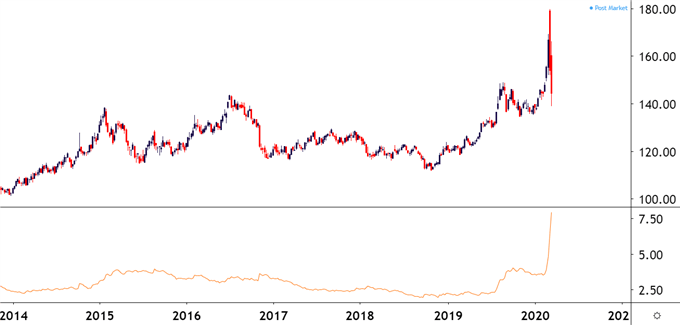
So, when there was a flight to quality, US Treasuries looked especially attractive, and there was a massive move of strength that shows very visibly in ‘TLT,’ which is the ticker symbol for an ETF representing US Treasuries with 20 years or more of maturity. The volatility here has spiked to extreme levels as last week’s surge has been followed by a sell-off of extreme magnitude, with the 30-year yield driving down to .84% two weeks ago and then spiking back-up to 1.9% today.
US Treasury 30 Year Bond Yield

Chart prepared by James Stanley; TYX on Tradingview
The big question here is ‘why,’ and as much as I’d wish to offer an answer, I’m not really sure; and I’d probably be skeptical of any simple answers or solutions that are offered. I’ve already heard much smarter people than myself say they have no clue what’s going on; and I haven’t seen any evidence since to offer a rational reason.
TLT – US Treasuries 20+ Years Maturity, with Average True Range (ATR) Applied

Chart prepared by James Stanley; TLT on Tradingview
Unpacking the Carnage
Up the stairs and down the elevator, as the saying goes; human beings are often more compelled, pound for pound, by fear than they are greed. Greed is often incremental, dipping ones toe in the water a little more and a little more until, eventually, they’re in. Fear often happens all-at-once, especially in a scenario such as we’re in right now that brings a considerable amount of uncertainty to the table.
One driver is clear, and that’s the novel coronavirus that continues to spread around-the-world. Most signs point to continued growth in most areas that it’s already taken hold and, for me in NYC, I’m not looking forward to the headlines that will punctuate local media in the days, weeks and, possibly even the months ahead.
But given the extreme nature of the moves combined with the lack of response in markets to the trove of stimulus efforts that have already been launched – the question must be asked whether something else is shifting or breaking in anticipation of some collateral damage from the coronavirus slowdown.
Perhaps it’s a knock-on effect of the brewing oil price war, which is taking place at a difficult time for the global economy; or maybe it’s some form of stress seen in the European economy’s future. The one item that’s clear is that this isn’t another simple ‘buy the dip’ scenario. As days go by and news worsens, it appears more and more likely that the world is heading for some long-term change.
One thing that is certain: FX markets are putting in huge moves and the US Dollar has surged after a strong sell-off in late-February/early-March. This is creating reverberations around the world and, likely, will entail additional volatility in related markets.
How can the Fed/US Treasury solve this problem? Again, I’m short of solutions and long on questions, but this could be seen as similar to the stagflation backdrop; when the late Paul Volcker had to engineer a ‘mild’ recession in the US by hiking rates to exorbitant levels in the effort of choking off extreme levels of inflation. In the years that followed, significant flows drove into the US Dollar until, eventually, the world needed a reset; and that took place during the 1985 Plaza Accord.
Another certainty: We’re living through history. And there’s no template for how a modern society and financial markets will respond to a growing pandemic of yet unknown magnitude.
--- Written by James Stanley, Strategist for DailyFX.com
Contact and follow James on Twitter: @JStanleyFX

