Dow Jones Industrial Average, Volatility Index, US-China Trade Deal – Talking Points:
- Sentiment notably soured during Asia-Pacific trade as the Japanese Yen and US Dollar rose.
- A resurgence of volatility looks to be in the offing as August draws to a close.
- Dow Jones at risk of extended declines as bearish RSI divergence hints at a rally running out of steam.
Asia-Pacific Recap
The haven-associated Japanese Yen and US Dollar clawed back lost ground against their major counterparts, as sentiment appeared to sour towards the tail-end of the Asia-Pacific trading session.
Gold slid back below $1,920 as the yield on the US 10-year Treasury Note climbed back above 70 basis points.
The Australian ASX 200 index fell 0.4% alongside S&P 500 futures whilst the US Dollar Index (DXY) rose.
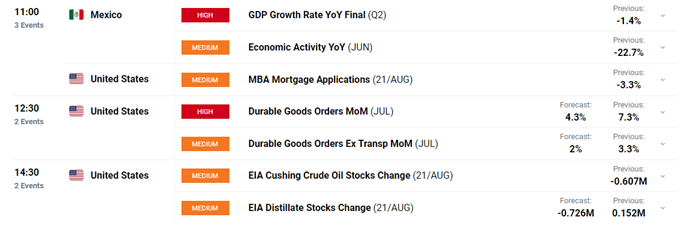
Looking ahead, US durable goods orders for July headline the economic docket ahead of EIA crude oil inventories for the week ending August 21.

Cooling US-China Tensions Suppress Volatility
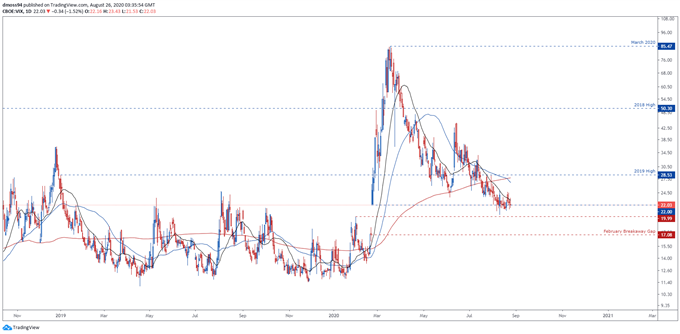
The market’s fear gauge – the CBOE Volatility Index or VIX – has steadily drifted lower since peaking on March 18, as central banks around the world injected an unprecedented amount of liquidity into the financial system in response to the novel coronavirus pandemic.
However, the uncertainty-defining index’s slide lower has stalled in recent days despite cooling US-China trade tensions and positive local economic data.
The Office of the US Trade Representative (USTR) stated that US and Chinese negotiators participated in a “regularly scheduled call” to review the phase-one trade deal on August 24, with “both sides seeing progress and committed to taking the steps necessary to ensure the success of the agreement”.
This press release served to temporarily buoy market sentiment, soothing concerns of a complete economic decoupling of the world’s two largest economies.
Volatility Index (VIX) Daily Chart – Bouncing Off Breakaway Support

Volatility Index (VIX) daily chart created using TradingView
Although this easing in tensions was followed up by robust economic data - US manufacturing PMI for August showed the fastest increase in factory activity since January 2019 - it failed to drive the volatility index back to pre-crisis lows.
In fact, the index has nudged marginally higher since failing to fill in the February breakaway gap, which suggests that a resurgence of volatility could be in the offing.
Therefore, investors should remain wary as the month of August draws to a close, with the VIX more than likely to rise at the expense of US asset prices if the upcoming Jackson Hole symposium triggers a risk-averse response.
Dow Jones Industrial Average Daily Chart – Shooting Star Candle Ominous for Bulls

Dow Jones Industrial Average (DJIA) daily chart created using TradingView
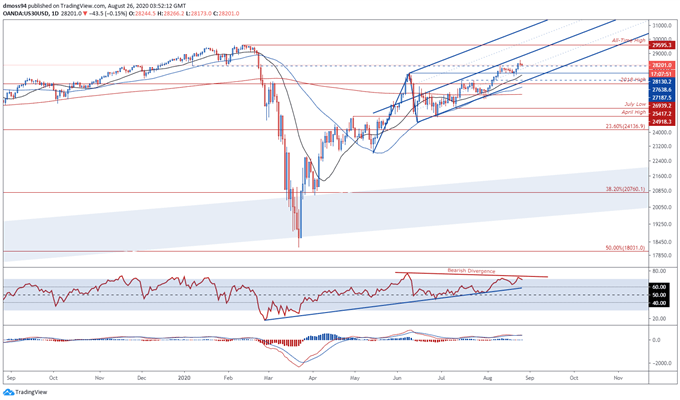
Bearish RSI divergence and a Shooting Star reversal candle above the January low (28130) paint an ominous picture for the Dow Jones Industrial Average and may inspire a near-term correction lower, if price breaks back below psychological support at the 28,000 level.
However, the steeping gradients of the 21-, 50- and 200-day moving averages are indicative of swelling bullish momentum and could result in any potential pullback being met with a wave of bargain-hunters attempting to “buy the dip”.
Nevertheless, price appears poised to slide back towards confluent support at the Pitchfork parallel and June high (27638.6), before potentially resuming its primary uptrend and pushing back towards the record high set in February (29595.3).
Conversely a daily close below the psychologically pivotal 27500 level would likely invalidate bullish potential and carve a path for price to fall back to support at the July high (27187.5).
-- Written by Daniel Moss, Analyst for DailyFX
Follow me on Twitter @DanielGMoss

