DAX 30 Index, German 10-Year Bund, EU Recovery Fund, Euro Session Brief – Talking Points
- Market participants seemingly dismissed US-China tensions as risk-sensitive assets broadly tracked higher during APAC trade.
- Germany’s 10-Year Bund is struggling at a key resistance level suggesting a potential resurgence of risk aversion could be around the corner.
- The German DAX 30 stock index looks poised for a short-term pullback as fading volume fails to confirm the recent upside burst.
Asia Pacific Recap
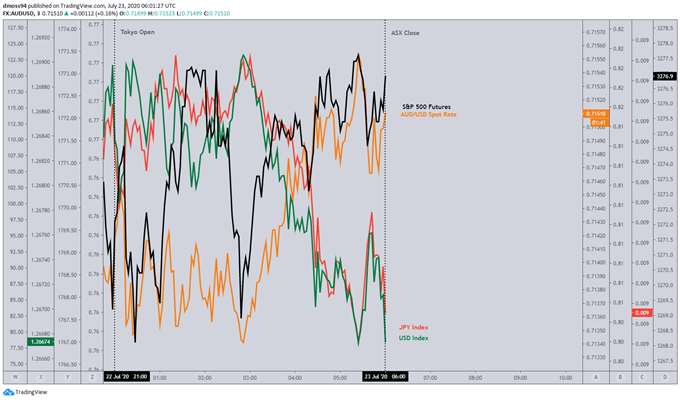
Investors seemed to brush aside a multitude of fundamental headwinds during Asia-Pacific trade as regional equity markets broadly tracked higher, despite US-China tensions escalating overnight.
The ASX 200 clawed back above 6,100 after another 403 Covid-19 cases were confirmed overnight in Victoria, Australia’s second most populous state.
The haven-associated Japanese Yen and US Dollar continued to slide against their major counterparts whilst the trade-sensitive Australia Dollar climbed to its highest levels since April 2019.
Silver lost ground after a monstrous 22% surge over the last four days whilst gold slipped after failing to break above key resistance at $1,880/oz.
Looking ahead, Eurozone consumer confidence headlines the economic docket ahead of second quarter corporate earnings from FAANG-behemoth Amazon.

Market Reaction chart created using Trading View
Falling Italian-German Yield Spread May Fuel Germany’s DAX 30 Index
The successful ratification of the European Union’s €750 billion coronavirus support package notably buoyed investor sentiment and underpinned the German DAX 30 index’s recent push to erase yearly losses.
Although European Central Bank President Christine Lagarde believes the fund's composition of €390 billion in grants and €310 billion in loans “could have been better”, generous concessions were made to quench the “Frugal Four” nation’s demands – Austria, Denmark, Sweden and the Netherlands – and ensure a deal was penned as quickly as possible.
Symbolizing an elevated level of cohesion in the European experiment and sending “a concrete signal that Europe is a force for action”, European Council President Charles Michel “believes this agreement will be a pivotal moment in Europe’s journey”.

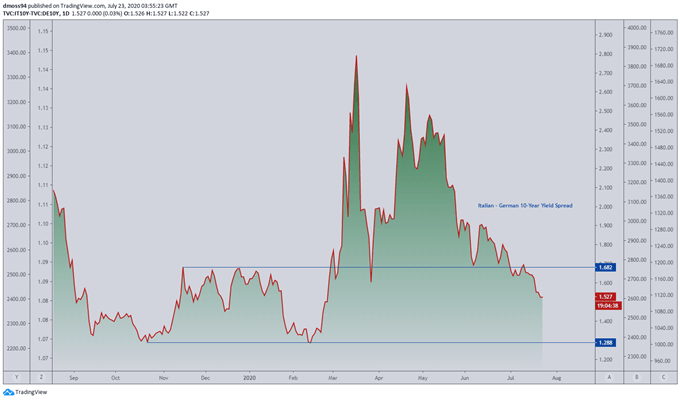
Italian-German 10-year Yield Spread chart created using TradingView
Michel’s overtly positive outlook was reflected in regional debt markets, with the yield spread between the Eurozone’s haven-associated asset, German 10-year bunds, and riskier Italian 10-year government bonds tightening to the lowest levels since early February.
The development of this relationship should be noted by regional equity investors, as a continued decline towards the February low (1.288) could coincide with the DAX 30 soaring to re-test the all-time high set earlier this year.
On the other hand, a marked appreciation back towards the July high (1.682) would imply a potential resurgence in risk aversion and possibly cap the German benchmark index’s upside.
German Bund Daily Chart – Struggling at Resistance as RSI Hints at Impending Reversal

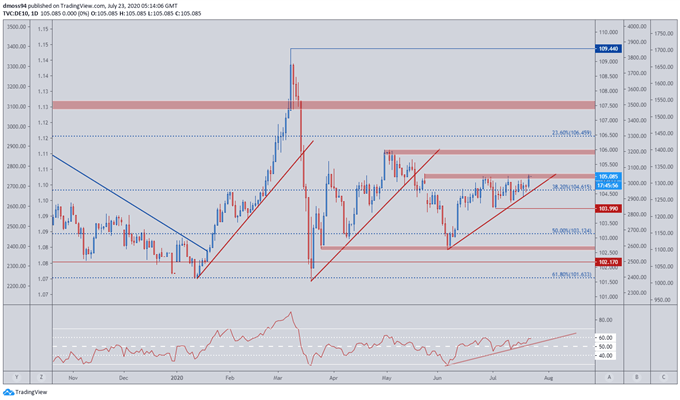
German Bund daily chart created using TradingView
From a technical perspective, Germany’s 10-year Bund continues its struggles at the June high as the RSI fails to break above 60 into bullish territory, suggesting an impending reversal may be on the cards.
However, price seems to be carving out a bullish Ascending Triangle continuation pattern as it sets a series of higher lows whilst capped by topside resistance, hinting that a break above the June high could ignite an impulsive surge to test the May high (105.99).
With that in mind, the development of the RSI may prove pivotal in dictating the future direction of price as a break above 60 and into overbought territory would probably generate a push above key resistance, potentially validating the bullish continuation pattern.
If the upside move eventuates, a period of sustained risk aversion looks more than likely.
On the other hand, a break and close below uptrend support and the 38.2% Fibonacci (104.62) may soothe investors’ concerns and potentially fuel capital inflows into European risk-associated assets.
DAX 30 Index Daily Chart – Running Out of Steam at the Yearly Open

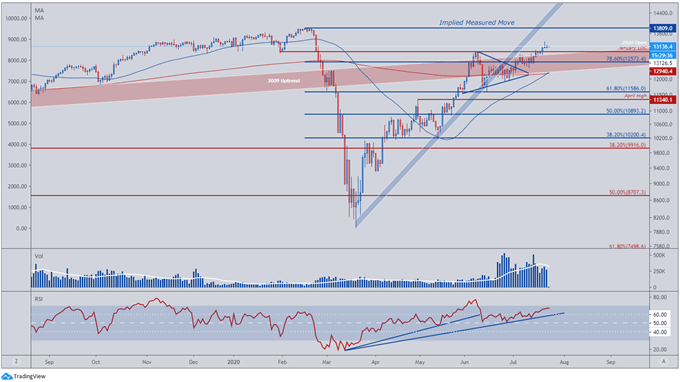
DAX 30 Index daily chart created using TradingView
As noted in previous reports, the topside break of Symmetrical Triangle consolidation generated an impulsive burst of buying pressure, driving the DAX 30 back to the 2020 open (13126) and erasing yearly losses.
However, upside momentum has faded significantly throughout the move higher as the RSI fails to follow price to higher highs, and fading volume indicates that buyers may be running out of steam.
Having said that, a ‘golden cross’ formation on the moving averages could stoke buyers as they eye a possible surge to retest the record high (13809).
Nevertheless, a short-term pullback to support at the January low daily close (12940) looks the more likely scenario, as a Shooting Star candle closing just below the yearly open (13126) implies an impending reversal may be in the offing.
-- Written by Daniel Moss, Analyst for DailyFX
Follow me on Twitter @DanielGMoss


