Canadian Dollar, USD/CAD, Loonie Talking Points
- While the US Dollar has been extremely strong, the Canadian Dollar has been fairly weak.
- USD/CAD blasted up to a fresh four-year-high earlier today.
- The bullish move has crossed above the psychological 1.4000 level without even much of a pause.
CAD Weakness Plus USD Strength Equals Massive Extension of Breakout
There’ve been a number of outsized moves in the FX market of recent, particularly in major pairs with USD; but few are as impressive as what’s shown in USD/CAD as the pair has jumped up to yet another fresh four-year-high. I had looked into this a couple of weeks ago as the US Dollar jumped-higher to start the week; helping to build in an outsized bullish gap in USD/CAD as the pair jumped above the 1.3500 level.
That gap still hasn’t filled and as the rush for US Dollar has only heated up since then: USD/CAD price action has shot up to yet another fresh four-year-high, crossing the 1.4000 level without even much of a pause as buyers crushed the bid.
USD/CAD Monthly Price Chart: Fresh Four-Year-Highs

Chart prepared by James Stanley; USDCAD on Tradingview
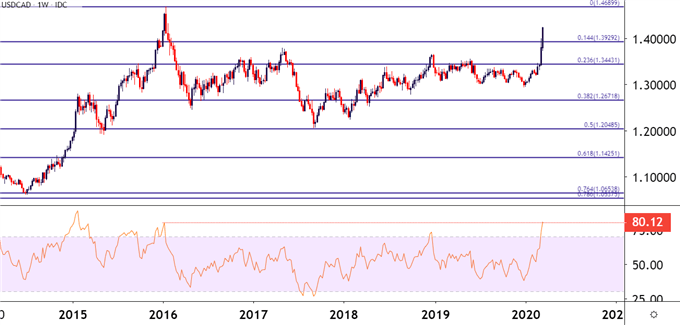
Taking a shorter-term look at the matter to help put this recent breakout into scope, and the overbought nature of the move could be problematic for bullish approaches. The RSI indicators has moved to its most overbought level since January of 2016, right around the time that USD/CAD started a reversal that lasted for a few months as more than 2,000 pips were taken out of the spot price. While RSI can be a difficult indicator for timing, it does highlight just how aggressively this move has been priced-in, making for a daunting backdrop to chase the move.
As looked at in today’s webinar, this is somewhat of a quandary with a number of FX markets at the moment as the move in USD has been extremely strong. This may be even more profound in USD/CAD as Canadian Dollar weakness has priced-in along with USD-strength.
USD/CAD Weekly Price Chart with RSI Applied

Chart prepared by James Stanley; USDCAD on Tradingview
USD/CAD Near-Term
Given the extreme nature of the move combined with the current area on the chart in which USD/CAD trades, and there’s a dearth of recent price action inflections to use for technical strategy. Traders would, in essence, need to project to some degree to find potential support or resistance levels. Sitting above current prices, the 1.4500 handle is a psychological level of note, and the 17-year-high is just beyond that, around 1.4690; but both of those prices are fairly far away from current price action, thereby making a difficult case to substantiate reversal scenarios.
On the support side of the matter, similarly, given a lack of recent historical context traders are going to need to project a bit, and incorporating a shorter-term chart may help to notice some near-term inflections.
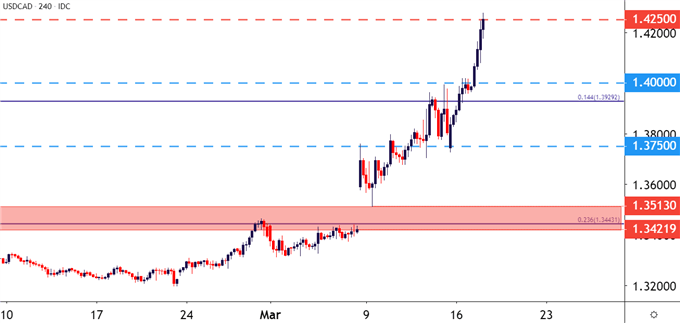
Current price action is testing a psychological level for the first time in over four years at the 1.4250 level. Inside of this, the 1.4000 psychological level looms large as this brought a brief pause to the upward advance but, as yet, hasn’t been tested for support. There’s a Fibonacci level around 70 pips below that, taken from the 14.4% retracement of the 2011-2016 major move. This level was perhaps even more forceful resistance on the way up than the 1.4000 level was; and below that, another psychological level exists around 1.3750. If none of those hold support, then the portion of unfilled gap lurks around the 1.3500 zone on the charts.
USD/CAD Four-Hour Price Chart

Chart prepared by James Stanley; USDCAD on Tradingview
--- Written by James Stanley, Strategist for DailyFX.com
Contact and follow James on Twitter: @JStanleyFX

