USD/CAD, Bank of Canada, Tiff Macklem, Canadian Retail Sales – Talking Points:
- Risk assets broadly outperformed their haven-associated counterparts during APAC trade, as the potential for further stimulus fueled regional equity markets.
- Canadian retail sales may buoy the Canadian Dollar should consumer spending exceed market expectations.
- The USD/CAD exchange rate is eyeing a push to fresh monthly lows after failing to break through sentiment-defining resistance.
Asia Pacific Recap
Regional equity markets surged during the Asia-Pacific trading session with the ASX 200 soaring 2.58% after Australian Prime Minister Scott Morrison announced an extension of the JobKeeper and JobSeeker programs.
The EUR/USD exchange rate pulled back from a fresh monthly high even though European leaders finally agreed upon the introduction of a further €750 billion in fiscal support.
Silver climbed a further 2.2% fueled at the expense of the haven-associated US Dollar, as Senate Majority Leader Mitch McConnell prepares to roll out a new $1 trillion federal support package by the end of July.
Looking ahead, Canadian retail sales and housing data headline a rather light economic docket, with earnings from United Airlines potentially proving noteworthy.
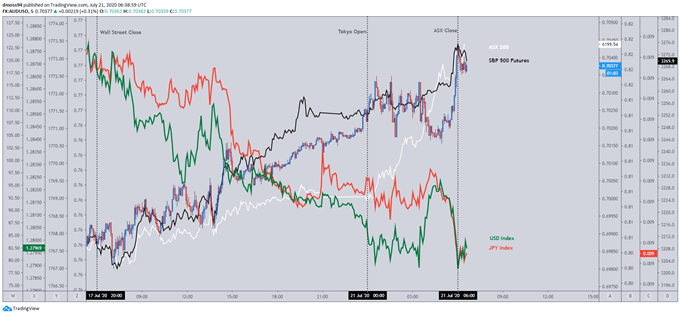
Market reaction chart created using TradingView
USD/CAD Eyes Fresh Monthly Lows Ahead of Canadian Retail Sales
Upcoming Canadian retail sales numbers for the month of May could buoy the risk-sensitive Canadian Dollar should the pick-up in consumer spending exceed market expectations and confirm Bank of Canada Governor Tiff Macklem’s statements that “early signs from the reopening phase are positive”.
Although a substantial jump in retail sales is to be expected, given the historic 26.4% slump recorded in April, Macklem believes that “consumers are likely to remain cautious with their spending’ as the fallout from the novel coronavirus outbreak has “shaken business and consumer confidence”.
However, the Governor believes “recent monthly data - particularly on employment, motor vehicle sales and housing – suggest that the Canadian economy hit bottom in April” after ADP employment figures for June showed private business hired a record 1.04 million employees – recovering from the staggering 2.06 million jobs shed in May.

Having said that, consumer confidence may continue to remain relatively suppressed as the BoC signalled “that the exceptionally strong near-term growth of the reopening phase is likely to give way to a slower and bumpier recuperation phase” with the central bank “prepared to provide further monetary stimulus as needed”.
Nevertheless, positive retail sales numbers may calm regional investors nerves, with a better-than-expected release potentially fueling the Canadian Dollar against its North American counterpart.
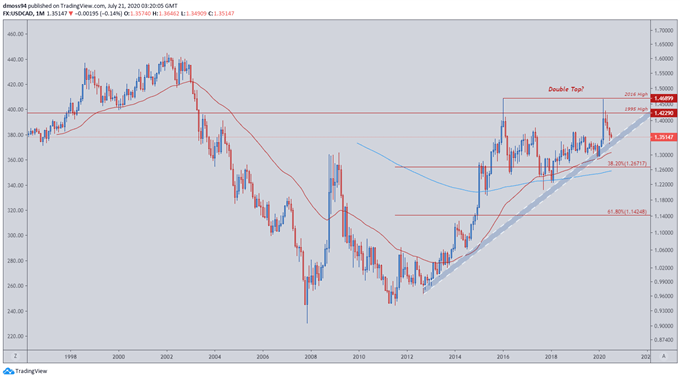
USD/CAD Monthly Chart – Long-Term Double Top Playing Out?
USD/CAD monthly chart created using TradingView
From a technical perspective, the medium-term outlook for the USD/CAD exchange rate seems tilted to the downside after price carved out a potential Double Top reversal pattern at the 2016 high (1.4690).
However, sellers still need to overcome the uptrend extending from the 2012 low (0.9633) to validate the bearish reversal pattern.
Moreover, the 50-month moving average (1.3086) hints at lingering bullish bias, as it notably steepens after crossing above its ‘slower’ 200-period counterpart (1.2564) in early 2017.
That being said, a test of the 2012 uptrend looks likely in the coming weeks and could prove to be a pivotal gut check for USD/CAD bulls, with a break signalling a potential decline towards the 200-month moving average (1.2579).
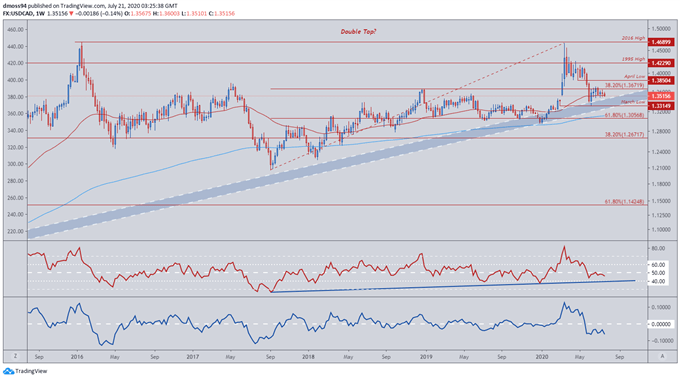
USD/CAD Weekly Chart – Sliding Below 50-WMA
USD/CAD weekly chart created using TradingView
Zooming into a weekly time-frame reinforces the bearishness seen in monthly price action as the RSI and Momentum indicators slide away from their respective bullish regions and price begins to push below the trend-defining 50-week moving average (1.3530).
A weekly close below the July low (1.3490) may clear a path for price to retreat to support at the March low (1.3315) with RSI breaking into oversold territory probably generating a sustained push to test the sentiment-defining 200-WMA (1.3120).
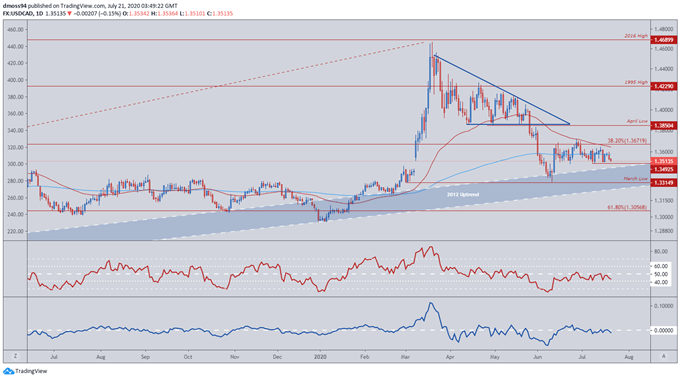
USD/CAD Daily Chart – 200-DMA Capping Potential Upside
USD/CAD daily chart created using TradingView
As it stands, short-term price action implies a push to fresh monthly lows may likely eventuate in coming days as USD/CAD buyers fail to hurdle resistance at the 200-day moving average (1.3575).
A daily close below the July low (1.3492) could intensify selling pressure, with the RSI breaking below 40 probably coinciding with a sustained pull-back to the March low (1.3315).
Moreover, a continued decline of the oscillator into oversold territory could fuel an impulsive downside move through the psychologically pivotal 1.33 level, signalling the resumption of the downtrend stretching from the March high (1.4667)
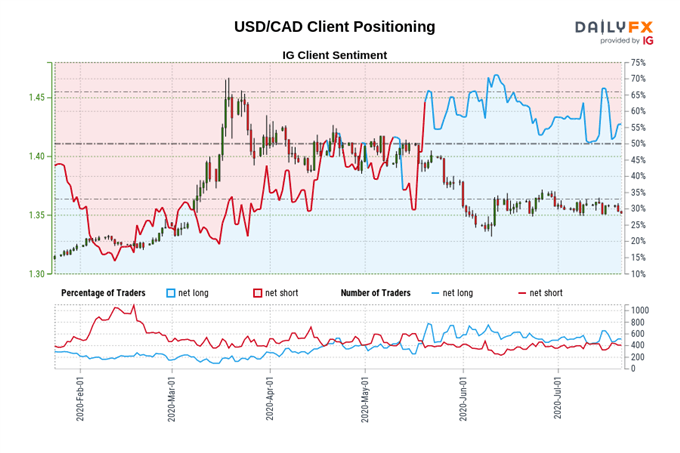
USD/CAD: Retail trader data shows 57.69% of traders are net-long with the ratio of traders long to short at 1.36 to 1. The number of traders net-long is 7.74% higher than yesterday and 9.75% higher from last week, while the number of traders net-short is 5.13% lower than yesterday and 6.95% lower from last week.
We typically take a contrarian view to crowd sentiment, and the fact traders are net-long suggests USD/CAD prices may continue to fall.
Traders are further net-long than yesterday and last week, and the combination of current sentiment and recent changes gives us a stronger USD/CAD-bearish contrarian trading bias.
-- Written by Daniel Moss, Analyst for DailyFX
Follow me on Twitter @DanielGMoss

