British Pound, GBP/USD, Brexit, EU Summit, IGCS – Talking Points:
- Asian equity markets lost ground during APAC trade as US-China tensions weighed on market sentiment.
- The increasing likelihood of a no-deal Brexit scenario may significantly undermine the politically-sensitive British Pound in the near term.
- GBP/USD rates at risk of reversal as price forms a bearish Shooting Star candle at key resistance.
Asia-Pacific Recap
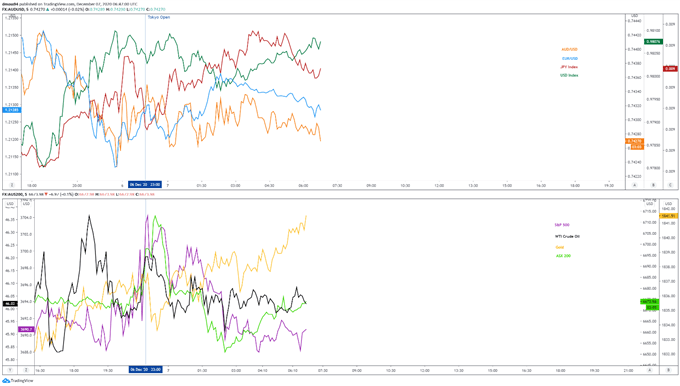
Asian equity markets broadly lost ground during Asia-Pacific trade, as investors mulled news that the Trump administration is preparing to sanction at least a dozen Chinese officials over their actions in Hong Kong.
Hong Kong’s Hang Seng index toppled 1.32% while China’s CSI 300 index fell 0.66%. Australia’s ASX 200 index climbed 0.62%, buoyed by a 13.9% rise in job advertisements as the easing of coronavirus restrictions continues to foster the nation’s economic recovery.
In FX markets, the cyclically sensitive Australian Dollar crept marginally higher despite robust trade data out of China, while the haven-linked USD and JPY clawed back lost ground against their major counterparts.
Gold nudged back above $1,840/oz as yields on US 10-year Treasury notes slipped back to 95 basis points.
Looking ahead, a rather light economic docket could see traders focus on ongoing Brexit negotiations as talks come down to the wire.
Market reaction chart created using Tradingview
No-Deal Brexit Fears Quickly Becoming Reality
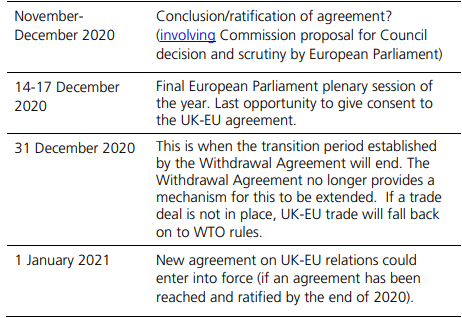
The increasing likelihood of a no-deal Brexit outcome could drastically undermine the politically-sensitive British Pound in the coming days, as negotiators from both sides scramble to get a deal across the line before the EU summit on December 10.
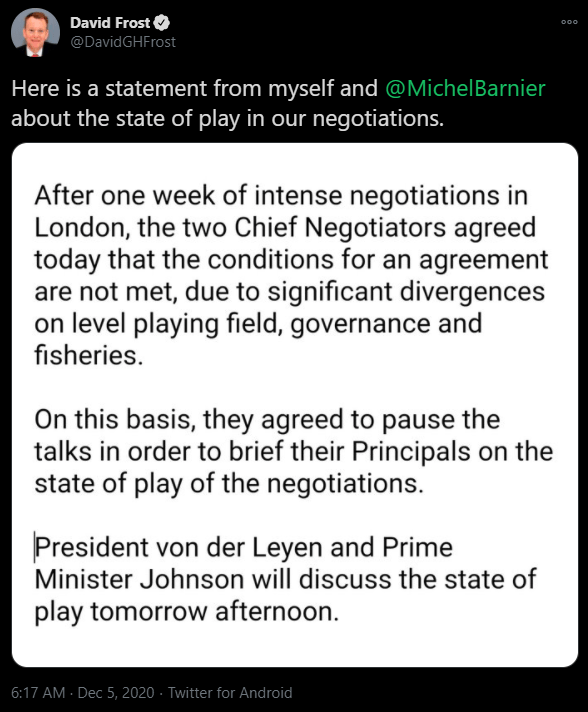
Talks fell apart late last week after UK chief negotiator David Frost and his European counterpart Michel Barnier released a joint statement, citing “significant divergences on level playing field, governance and fisheries” as major factors preventing an agreement from being met.
These three issues have been a consistent stumbling block for negotiations and it seems relatively unlikely that, at this stage of the game, either side will compromise.
After all, French European Affairs Minister Clement Beaune has warned that “if there was an agreement and it was not good, we would oppose it with a right of veto”, adding that “I still hope that we can have an agreement, but we will not accept a bad deal for France”.
Moreover, French President Emmanuel Macron has reportedly lobbied the EU to push negotiations past the year-end deadline to pressure the UK to concede ground on several key issues.
That in mind, it appears that the prospect of Britain tumbling out of the EU without a ratified free-trade agreement is becoming more likely by the day, with Irish Prime Minister Micheal Martin stating that “things are on a knife edge here and it is serious”.
Therefore, the British Pound could be at risk of significant losses in the near term, if the call between British Prime Minister Boris Johnson and European Commission President Ursula von der Leyen later today fails to show any signs of meaningful progress towards a deal.
Source – UK House of Commons
GBP/USD Daily Chart – Shooting Star Hints at Reversal
From a technical perspective, GBP/USD rates could be poised to reverse lower as price forms a bearish Shooting Star reversal candle just below key resistance at the 2019 high (1.3515).
Significant bearish RSI divergence, in tandem with a bearish MACD crossover, suggests that the path of least resistance is skewed to the downside.
Breaking back below the 88.6% Fibonacci (1.3391) could ignite a pullback towards the 1.3300 mark, with a break below bringing the March high (1.3200) into focus.
Alternatively, gaining a firm foothold above 1.3500 on a daily close basis would probably neutralize near-term selling pressure and carve a path for price to probe the May 2018 high (1.3665).
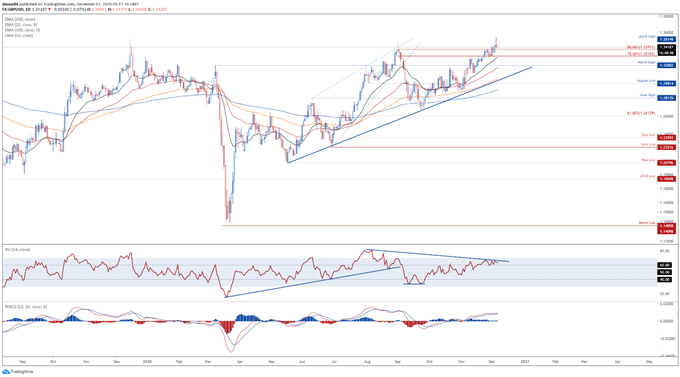
GBP/USD daily chart created using Tradingview
GBP/USD 4-Hour Chart – 21-MA Capping Upside Potential
Zooming into a four-hour chart also hints at further downside as prices fail to remain constructively perched above range support at 1.3466 – 1.3480 and slip back below the Pitchfork median line.
GBP/USD looks set to slide back towards the 100-MA and 78.6% Fibonacci (1.3310) in the near term, if support at the 88.6% Fibonacci (1.3391) gives way.
Clearing the psychological pivotal 1.3300 mark could trigger a more extended correction and open the door for sellers to challenge the sentiment-defining 200-MA (1.3227) and March high (1.3200).
Conversely, pushing back above the 21-MA and Pitchfork median line could inspire a retest of the monthly high (1.3539).
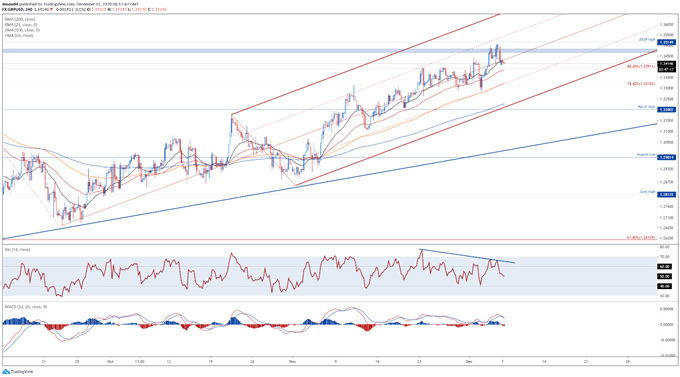
GBP/USD 4-hour chart created using Tradingview
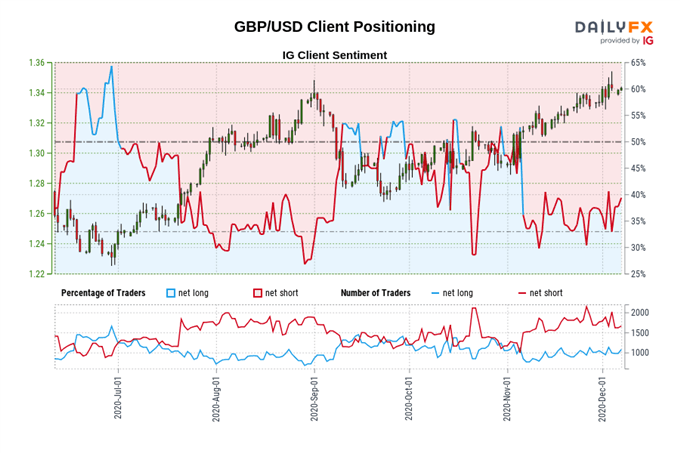
IG Client Sentiment Report
Retail trader data shows 40.19% of traders are net-long with the ratio of traders short to long at 1.49 to 1. The number of traders net-long is 15.37% higher than yesterday and 6.03% higher from last week, while the number of traders net-short is 3.78% higher than yesterday and 6.16% lower from last week.
We typically take a contrarian view to crowd sentiment, and the fact traders are net-short suggests GBP/USD prices may continue to rise.
Yet traders are less net-short than yesterday and compared with last week. Recent changes in sentiment warn that the current GBP/USD price trend may soon reverse lower despite the fact traders remain net-short.
-- Written by Daniel Moss, Analyst for DailyFX
Follow me on Twitter @DanielGMoss


