British Pound, Brexit Trade Deal, GBP/JPY, GBP/USD, IGCS – Talking Points:
- Equity markets traded mixed during the APAC session in light pre-holiday trade.
- The ratification of Britain’s post-Brexit trade deal with the EU may bolster the British Pound.
- GBP/USD challenging key range resistance.
- GBP/JPY poised to extend recent topside push as price pierces psychological resistance.
Asia-Pacific Recap
Equity markets traded mixed during Asia-Pacific trade in thin pre-holiday trading volumes, as investors mulled the pace of global vaccine distributions.
Australia’s ASX 200 slid 1.43% as Victoria ended a 61-day virus-free streak, recording 6 new locally-acquired Covid-19 cases, and infections in New South Wales continued to climb. Japan’s Nikkei 225 also slipped lower as Tokyo recorded over 1,000 new infections.
China’s CSI 300 index stormed 1.45% higher despite registering a slowdown in manufacturing and non-manufacturing activity in December, as Sinopharm announced that its coronavirus vaccine is effective in preventing infection in 79.3% of subjects.
In FX markets, the cyclically-sensitive AUD, NZD and CAD largely outperformed while the haven-associated US Dollar continued to lose ground against its major counterparts. Gold and silver prices slipped lower despite yields on US 10-year Treasuries holding steady at 0.93%.
Looking ahead, US jobless claims data for the week ending December 26 headlines a rather light economic docket.

Approval of Brexit Trade Deal May Bolster GBP
The long awaited approval of Britain’s post-Brexit trade deal with the European Union may bolster the British Pound in the near term, as UK lawmakers approved the historic agreement just 24 hours before the final deadline on December 31.
Prime Minister Boris Johnson stated after the ratification of the trade deal that “the destiny of this great country now resides firmly in our hands”, adding that “we take on this duty with a sense of purpose and with the interest of the British public at the heart of everything we do”.
However, the agreement has very limited provisions for the local services industry – which accounts for 80% of the British economy – which could severely hamper the nation’s economic recovery. Nevertheless, with the UK and EU locking in tariff-free and quota-free trade in goods, investors may put a premium on GBP in the short-term.
Moreover, regulatory clearance of the coronavirus vaccine produced by the University of Oxford and AstraZeneca may also buoy the local currency. Health Secretary Matt Hancock believes that with both AstraZeneca and Pfizer’s vaccines now being actively distributed, the country could overcome the novel coronavirus by spring 2021.
GBP/USD Daily Chart – Probing Key Resistance Range
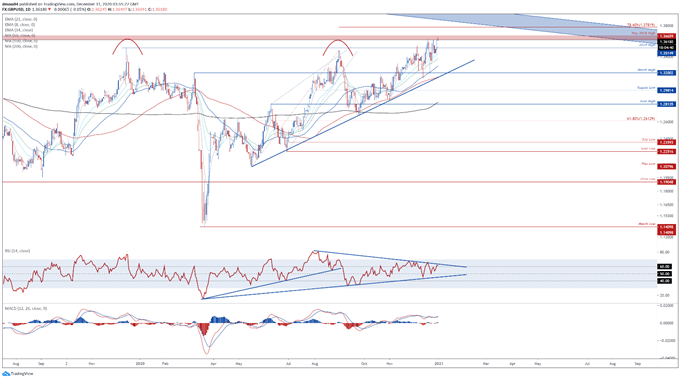
GBP/USD daily chart created using Tradingview
From a technical perspective, GBP/USD rates are challenging a key resistance range at 1.3610 – 1.3650, after bursting through the psychologically imposing 1.3600 mark.
Bullish moving average stacking, in tandem with a bullish crossover on the MACD indicator, suggests the path of least resistance favours the upside.
A daily close above the May 2018 high (1.3666) would probably neutralize near-term selling pressure and clear a path for prices to probe the 78.6% Fibonacci (1.3782).
Conversely, failure to gain a firm foothold above the resistance range could trigger a pullback towards confluent support at the 2019 high (1.3514) and the 8-day exponential moving average.
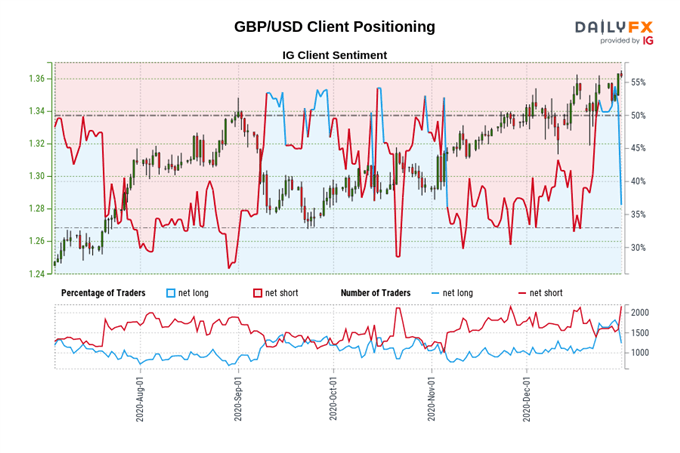
The IG Client Sentiment Report shows 38.71% of traders are net-long with the ratio of traders short to long at 1.58 to 1. The number of traders net-long is 26.76% lower than yesterday and 32.17% lower from last week, while the number of traders net-short is 29.23% higher than yesterday and 22.15% higher from last week.
We typically take a contrarian view to crowd sentiment, and the fact traders are net-short suggests GBP/USD prices may continue to rise.
Traders are further net-short than yesterday and last week, and the combination of current sentiment and recent changes gives us a stronger GBP/USD-bullish contrarian trading bias.
GBP/JPY Daily Chart – Schiff Pitchfork Guiding Price Higher
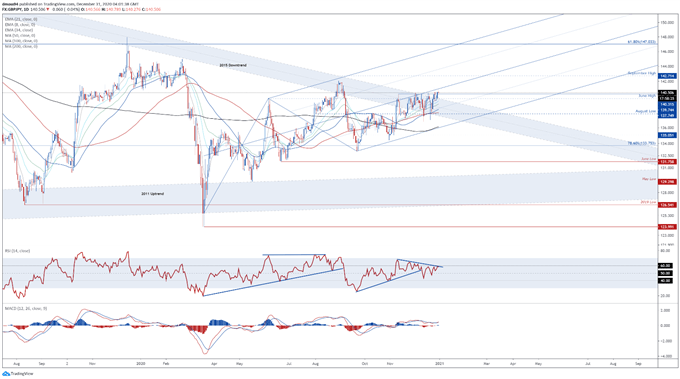
GBP/JPY daily chart created using Tradingview
GBP/JPY also looks set to extend its recent topside push, as price remain constructively perched above key support at the November high (140.31) and psychologically pivotal 140.00 level.
With both the RSI and MACD indicator tracking firmly above their respective neutral midpoints, further gains appear in the offing.
Pushing above the December high (141.21) and Schiff Pitchfork median would probably generate an impulsive push to test the September high (142.71).
Alternatively, falling back below 140.00 could allow sellers to regain control of the exchange rate and drive prices back towards the 34-EMA (139.05).
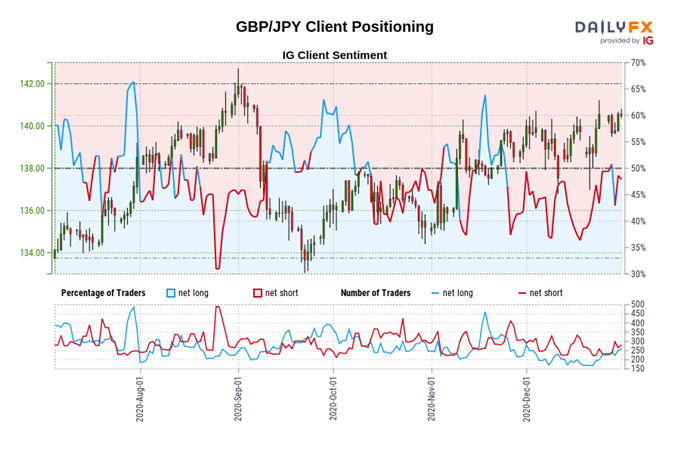
The IG Client Sentiment Report shows 50.19% of traders are net-long with the ratio of traders long to short at 1.01 to 1. The number of traders net-long is 0.76% lower than yesterday and 29.85% higher from last week, while the number of traders net-short is 1.52% lower than yesterday and unchanged from last week.
We typically take a contrarian view to crowd sentiment, and the fact traders are net-long suggests GBP/JPY prices may continue to fall.
Traders are further net-long than yesterday and last week, and the combination of current sentiment and recent changes gives us a stronger GBP/JPY-bearish contrarian trading bias.
-- Written by Daniel Moss, Analyst for DailyFX
Follow me on Twitter @DanielGMoss


