Chinese PMI, Hong Kong GDP, AUD/NZD, USD/CNH – Talking Points
- Wall Street Indices closed in the red today as Treasury yields climbed
- New Zealand Business PMI shows manufacturing activity expanding
- USD/CNH, AUD/NZD focusing on Chinese FDI and Hong Kong GDP
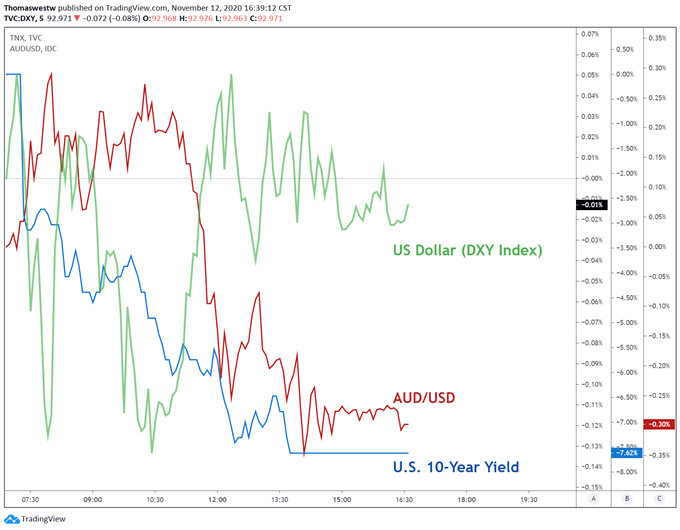
The Wall Street trading session closed to the downside with major US indices finishing in the red. The Dow Jones index led the pack lower, closing 1.08% lower. In line with the risk-off tilt, U.S. Treasury yields fell across the curve. The 10-year yield dropped nearly 8% on the day. The boost in bond buying likely reflected worry over the continuing rise in Covid cases seen in the United States. As of Tuesday, the U.S. had 65.4k people hospitalized from Covid according to the Covid Tracking Project.
Commensurate with the risk-off mood in markets, spot gold prices edged higher, likely a result of the decrease in U.S. Treasury yields. The US Dollar Index (DXY) was largely unchanged on the day and hovered under the 93 handle. The greenback fared slightly better against the Australian Dollar. Still, AUD/USD remains nearly 3% higher for November.
DXY Index, AUD/USD, U.S. Ten-Year Yield – 5-Min Price Chart

Chart created with TradingView
Friday’s Asia Pacific Outlook
The New Zealand Dollar, along with the Australian Dollar, may present actionable movement to close out the week. Earlier, BusinessNZ’s PMI report showed a 51.7 figure for October according to the DailyFX Economic Calendar. The reading above 50.0 indicates expanding growth, albeit at a slower pace than the previous month’s 54.0 level.
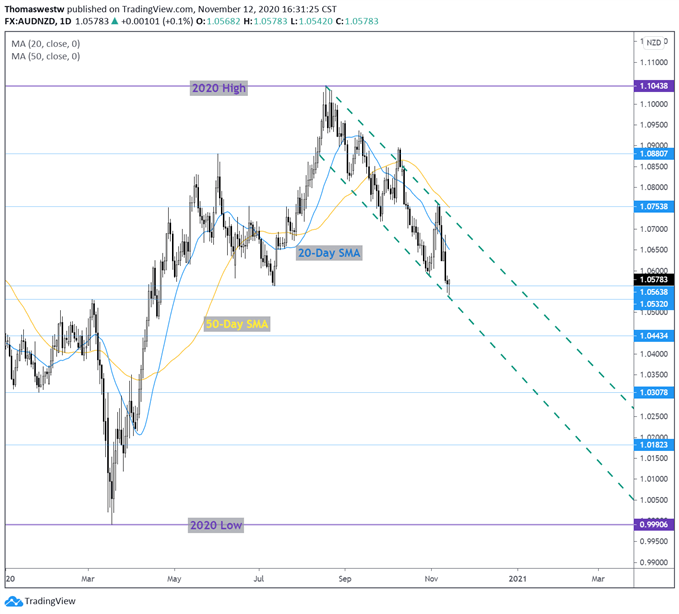
Consequently, and along with this week’s RBNZ rate decision, the New Zealand Dollar looks poised to appreciate in the near-term. AUD/NZD, however, is approaching the bottom of a downward channel formed from the August swing high. A risk-on rally could prompt Australian Dollar strength. Therefore, it may be prudent to wait for any positive headline risks to bring AUD/NZD up against the top trendline of the channel.
AUD/NZD Daily Price Chart

Chart created with TradingView
Chinese FDI, Hong Kong GDP in Focus
Today will bring Foreign Direct Investment data out of China and the finalized reading of Hong Kong’s Q3 GDP data. The DailyFX Economic Calendar expects China’s FDI to cross the wires at 2.5%, down from September’s 5.2%. Hong Kong is expected to report a positive 3% growth rate for the third quarter quarter-over-quarter. On a year-over-year basis, Hong Kong is expected to remain negative, however, at negative 3.4%.
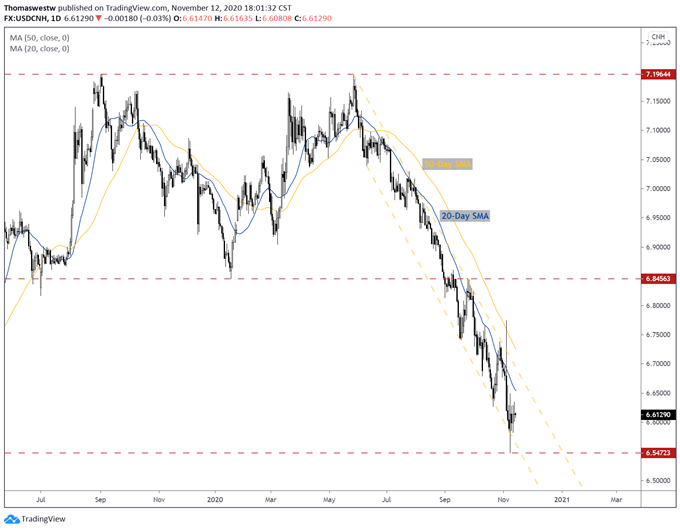
The data will likely spur movement in the offshore Yuan. USD/CNH is currently over 7% lower from its 2020 September high. Earlier this year, the pair collapsed into a downward channel after failing to break above key resistance at 7.1964. A material directional shift in price could have a low-probability chance considering the bearish technical picture. The backdrop of a possible Biden administration may also keep the Yuan in a stronger position versus the dollar, for now.
USD/CNH Daily Price Chart

Chart created with TradingView
Written by Thomas Westwater, Analyst for DailyFX.com
Contact Thomas at @FxWestwater


