
USD/JPY Elliott Wave Analysis: Bullish Pattern Emerges

JPY Elliott Wave Talking Points:
- Yen price action supports a continued bullish run from the January 2019 low
- A bullish 5-3 Elliott wave pattern appears complete from the May 13 low
- Bullish wave relationships discussed in January remain in play
Back on January 3, 2019, we argued the case for a multi-year bull market in USD/JPY. To date, the price action for USD/JPY using Elliott Wave Theory supports the longer-term bullish view.
We are tracking a bullish 5-3 wave pattern for USD/JPY. This is where you have a 5 wave motive wave to start a new trend followed by a three wave partial retracement.
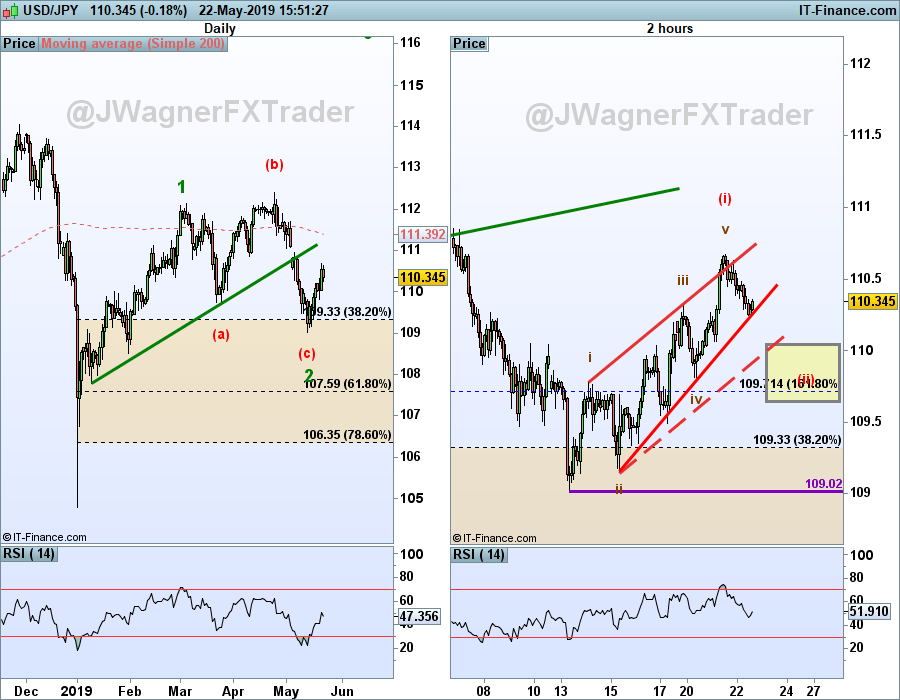
The motive wave began on January 2, 2019 and carried to March 5, 2019. From there, a sideways flat pattern carved in three waves labeled (a)-(b)-(c). The wave structure from the May 13 low appears to be a leading diagonal pattern. If this interpretation is correct, then another large rally may begin soon.
The current Elliott Wave for USDJPY
The USD/JPY daily price chart (left image above) labels the larger degree of trend in green. We believe that wave ‘2’ finished on May 13 and wave ‘3’ is in the beginning stages towards higher levels. Initial wave relationships appear near 117 and 120. As we argued in the January 3 report, even higher levels are under consideration.
Therefore, we are considering the current Elliott wave for USD/JPY to be wave (ii) of 3.
In the near-term, if USDJPY prices fall below 109.02, then we will need to reconsider the wave count. However, the longer-term view remains valid with USDJPY above the January 2 low.
Elliott Wave FAQs
How does Elliott Wave theory work?
Elliott Wave theory is a trading study that identifies the highs and lows of price movements on charts via wave patterns. Traders analyze the waves for 5-wave moves and 3-wave corrections to determine where the market is at within the larger pattern. Additionally, the theory maintains three rules and several guidelines on the depth of the waves related to one another. Therefore, it is common to use Fibonacci with Elliott Wave analysis. We cover these topics in our beginners and advanced Elliott wave trading guides.
---Written by Jeremy Wagner, CEWA-M
Jeremy Wagner is a Certified Elliott Wave Analyst with a Master’s designation. These articles are designed to illustrate Elliott Wave applied to the current market environment. See Jeremy’s bio page for recent Elliott Wave articles to see Elliott Wave Theory in action.
Discuss this market with Jeremy in Monday’s US Opening Bell webinar.
Follow on twitter @JWagnerFXTrader .
Recent Elliott wave articles
Challenges And Rewards Of Expat Life In Asia
The freedoms, novelties, and richness of new experiences that typify the expat way of living constitute the crux of the ... Read more
NZD/USD Wedge Breakout Back In Play As US Dollar Strength Cools
NZD/USD is looking higher ahead of Australian and New Zealand inflation expectations. Meanwhile, China's credit conditio... Read more
Australian Dollar Outlook: AUD/USD Eyes Westpac Consumer Confidence
The Australian Dollar is seeing a mild rebound following a Rising Wedge breakdown. AUD/USD may see volatility on Westpac... Read more
NZD/USD May Weaken As Goldman Sachs Downgrades Chinese Growth Outlook
The New Zealand Dollar fell overnight against the US Dollar as Covid and Chinese economic downgrades weighed on sentimen... Read more
AUD/USD Threatens Key Technical Level As Chinese Inflation Data Nears
AUD/USD is threatening a breakdown as prices test support at the floor of a Rising Wedge chart pattern. Chinese inflatio... Read more
Australian Dollar Forecast: AUD/USD May Move On RBA, Covid, China, US NFPs
The Australian Dollar is benefiting from a rebound in sentiment after Wall Street closed higher. AUD/USD looks to the RB... Read more