

Canadian Dollar Outlook
- USD/CAD charts and analysis
- US Dollar against Canadian Dollar price action
Check our latest Q3 forecasts for free and learn what is likely to move the markets at this time of the year.
USD/CAD – Weaker Sellers
On Tuesday, USD/CAD printed 1.3134 – its lowest level in six weeks. However, the pair rallied after then settled above 1.3200 handle.
Alongside this the Relative Strength Index (RSI) climbed from 36 to 46 in two days indicating to seller’s loss of momentum.
Just getting started? See our Beginners’ Guide for FX traders
USD/CAD DAILY PRICE CHART (April 4 – Sep 13, 2019) Zoomed Out
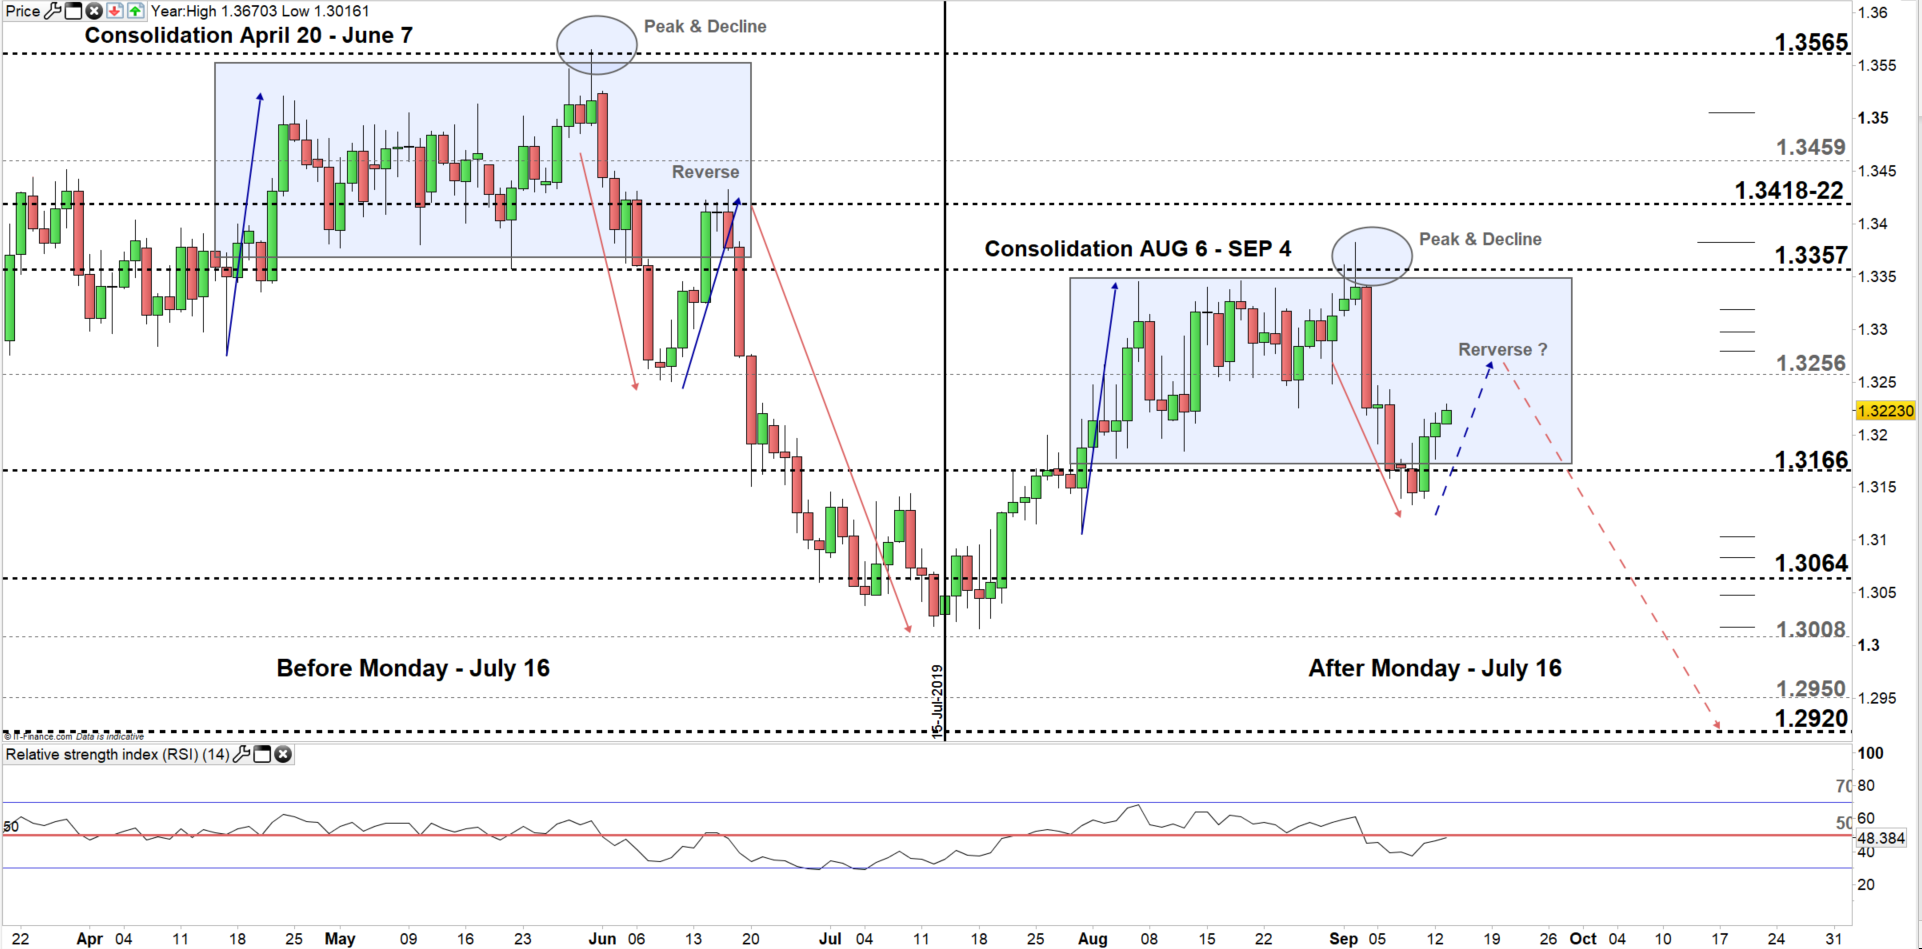
Following USD/CAD move on the daily chart, we notice a kind of pattern the pair has been trading with. The price consolidated from April 20 to June 7, peaked then declined below the consolidation area. On June 10, USDCAD U-turned back to the old consolidation area, then reversed and plummeted to its lowest in nearly nine months.
Currently, USDCAD chart moves in a similar pattern. The pair consolidated from Aug 6 to Sep 4, peaked then declined below the consolidation area. On Sep 10, the pair U- turned back to the old consolidation area. Possibly, the pair may keep trading in the same pattern i.e. it could reverse then plummet on the long run to the levels marked on the chart (Zoomed out).
Having trouble with your trading strategy? Here’s the #1 Mistake That Traders Make
USD/CAD DAILY PRICE CHART (JUly 1 – Sep 13, 2019) Zoomed In

From the daily chart, we notice on Wednesday USD/CAD rallied back to the trading zone 1.3166 – 1.3256 eyeing a test of the high end of the zone.
Thus, a close above the high end could push USDCAD towards 1.3357. That said, the weekly resistance levels underlined on the chart (zoomed in) should be kept in focus.
On the flip side, any failure to close above the high end may change the pair’s direction sending it back towards the low end. Further close below the low end might press USDCAD towards 1.3064. In that scenario, the daily support area with the weekly support levels underscored on the chart need to be watched closely.
We value your opinion, please access short online survey
Written By: Mahmoud Alkudsi
Please feel free to contact me on Twitter: @Malkudsi