

S&P 500, Trump-Biden Spread, 2020 Presidential Election – TALKING POINTS
- Markets contending with novel geopolitical risk as China announces new chip policy
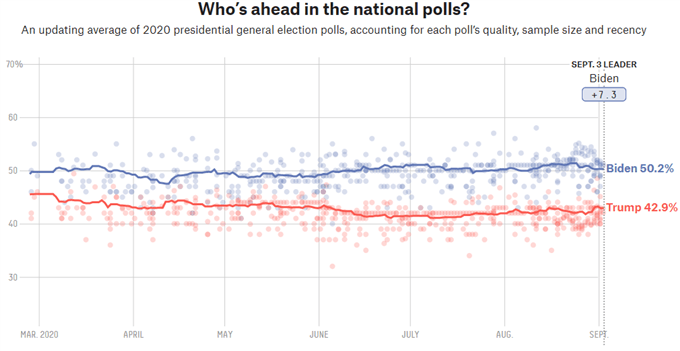
- Recent polling reports continue to show Biden in the lead with an average of 8 points
- S&P 500 index testing mid-June uptrend after suffering the biggest loss since June 11
61 DAYS UNTIL THE US PRESIDENTIAL ELECTION
With 61 days to go until the presidential election, Biden continues to lead Trump – albeit at a modestly smaller margin – heading into the first presidential debate on September 29. Numerous polling agencies are showing varying degrees of difference, though the spread below is roughly in-line with the 8-point average found in RealClearPolitics’ data.
2020 Election Polling Data
For additional political updates, be sure to follow me on Twitter @ZabelinDimitri.
China Semi-Conductor Chip Policy Another Risk Waiting After 2020 Election
While the presidential debate is the biggest, near-term election event to watch for, recent geopolitical developments between the US and China signal another headwind a new administration will have to sail against. On Thursday, Beijing announced plans to add a provision to the country’s 14th five-year plan for boosting the domestic production of third-generation semiconductors through 2025.
The measure comes in response to the Trump Administration’s efforts to curb China’s importation and use of US-based chipmaking technologies. Washington has even gone so far as to ban all chip suppliers from selling their goods to Asian tech giants like Huawei if the hardware being sold uses American equipment. Consequently, this has pushed Beijing to start rapidly developing its own chipmaking industry.
Following the election, regardless of which administration it is, policymakers will have to deal with the economic repercussions of US-led digital protectionism. In addition to the geopolitical strains that it causes, supply chain-oriented firms that rely on the uninterrupted movement of key inputs may suffer as they scramble to reposition themselves in a new international digital regime.
S&P 500 Analysis
After reaching a record-high, on Thursday, the S&P 500 had its biggest one-day drop since June 11. The index is now retesting an uptrend that was formed in mid-June. Breaking the slope of appreciation could send a chilling message about the benchmark’s near-term trajectory, potentially setting it up for an aggressive, short-term retreat. Selling pressure could encounter some friction at former resistance-turned-support at 3391.75.
S&P 500 Futures – Daily Chart
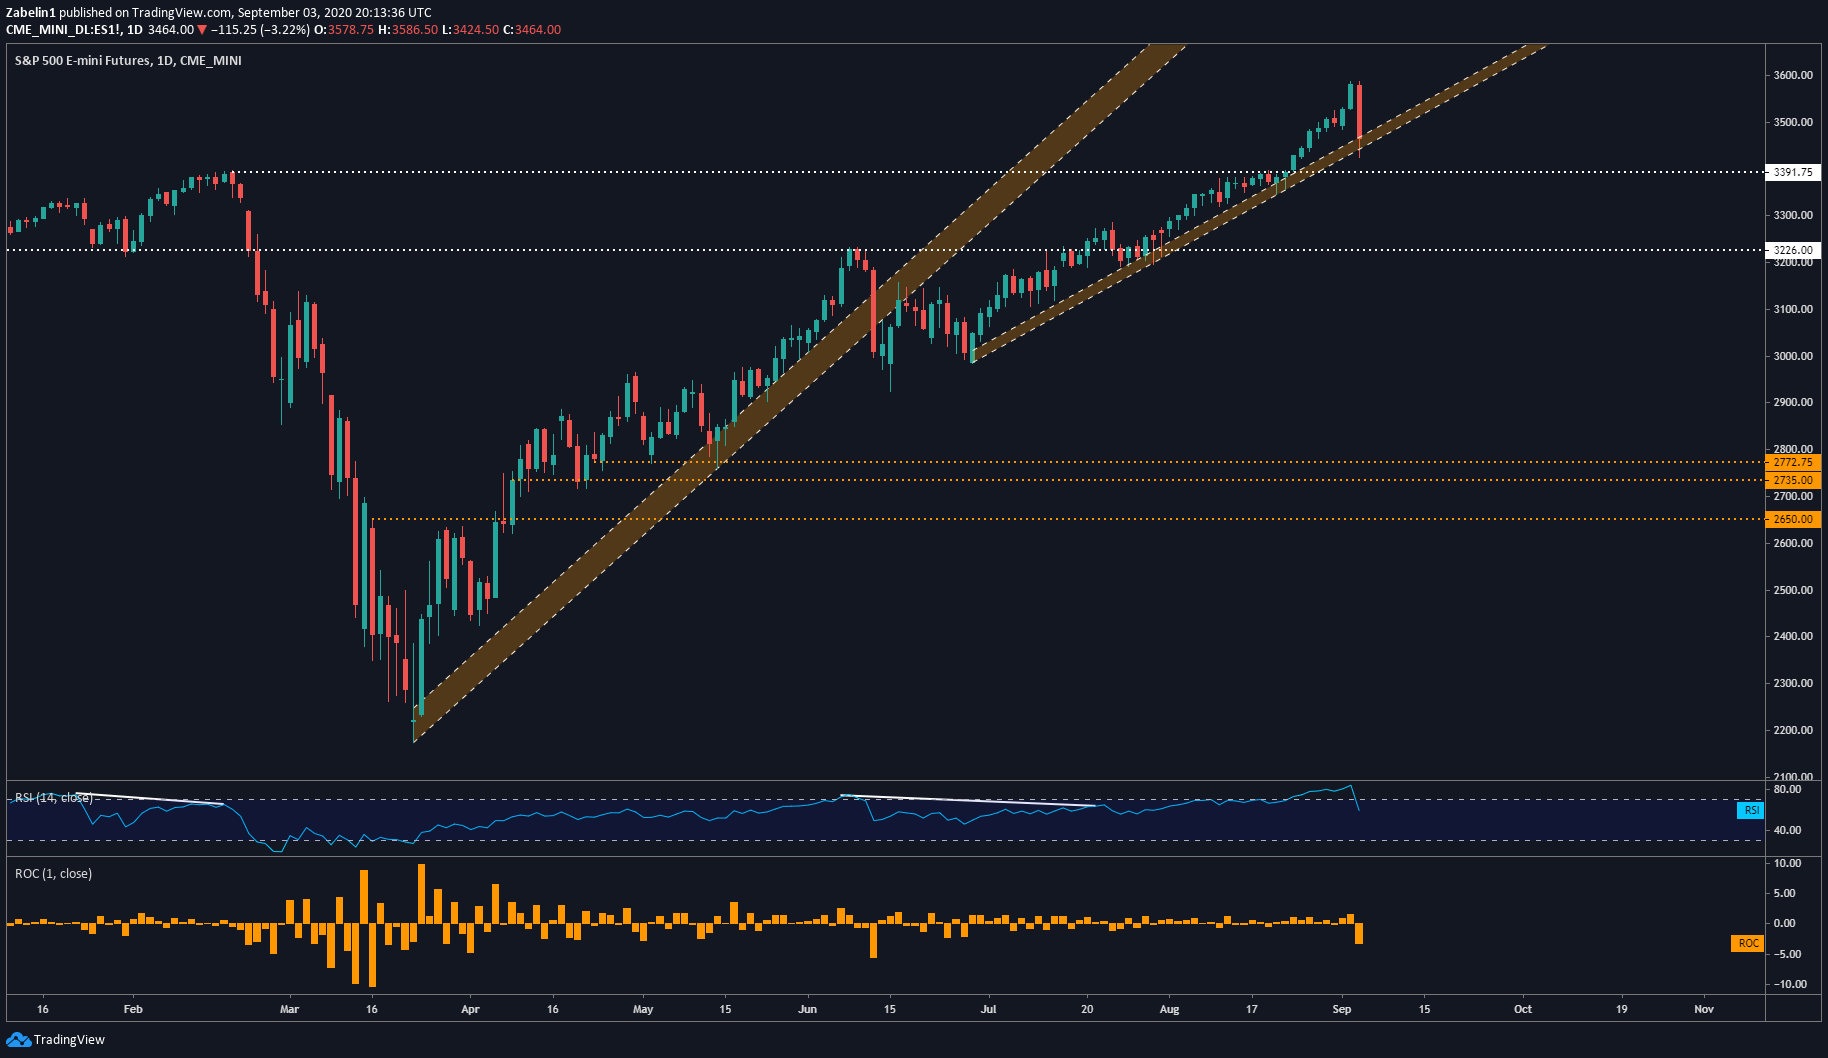
S&P 500 chart created using TradingView
--- Written by Dimitri Zabelin, Currency Analyst for DailyFX.com
To contact Dimitri, use the comments section below or @ZabelinDimitri on Twitter