

Gold Price Technical Outlook:
- Gold remains capped by 2011/12 levels
- Rising channel line keeping supported
- H&S formation near trigger point
For an intermediate-term fundamental and technical viewpoint, see the Gold Forecast.
Gold remains capped by 2011/12 levels
Long-term resistance from the 2011/12 topping process (1422/1475) has been a major headwind for over a month now, with several failed attempts to rally gold price on through. If the topping formation that has been developing during the battle at resistance comes to fruition, then look for it to be awhile longer before higher levels can be achieved.
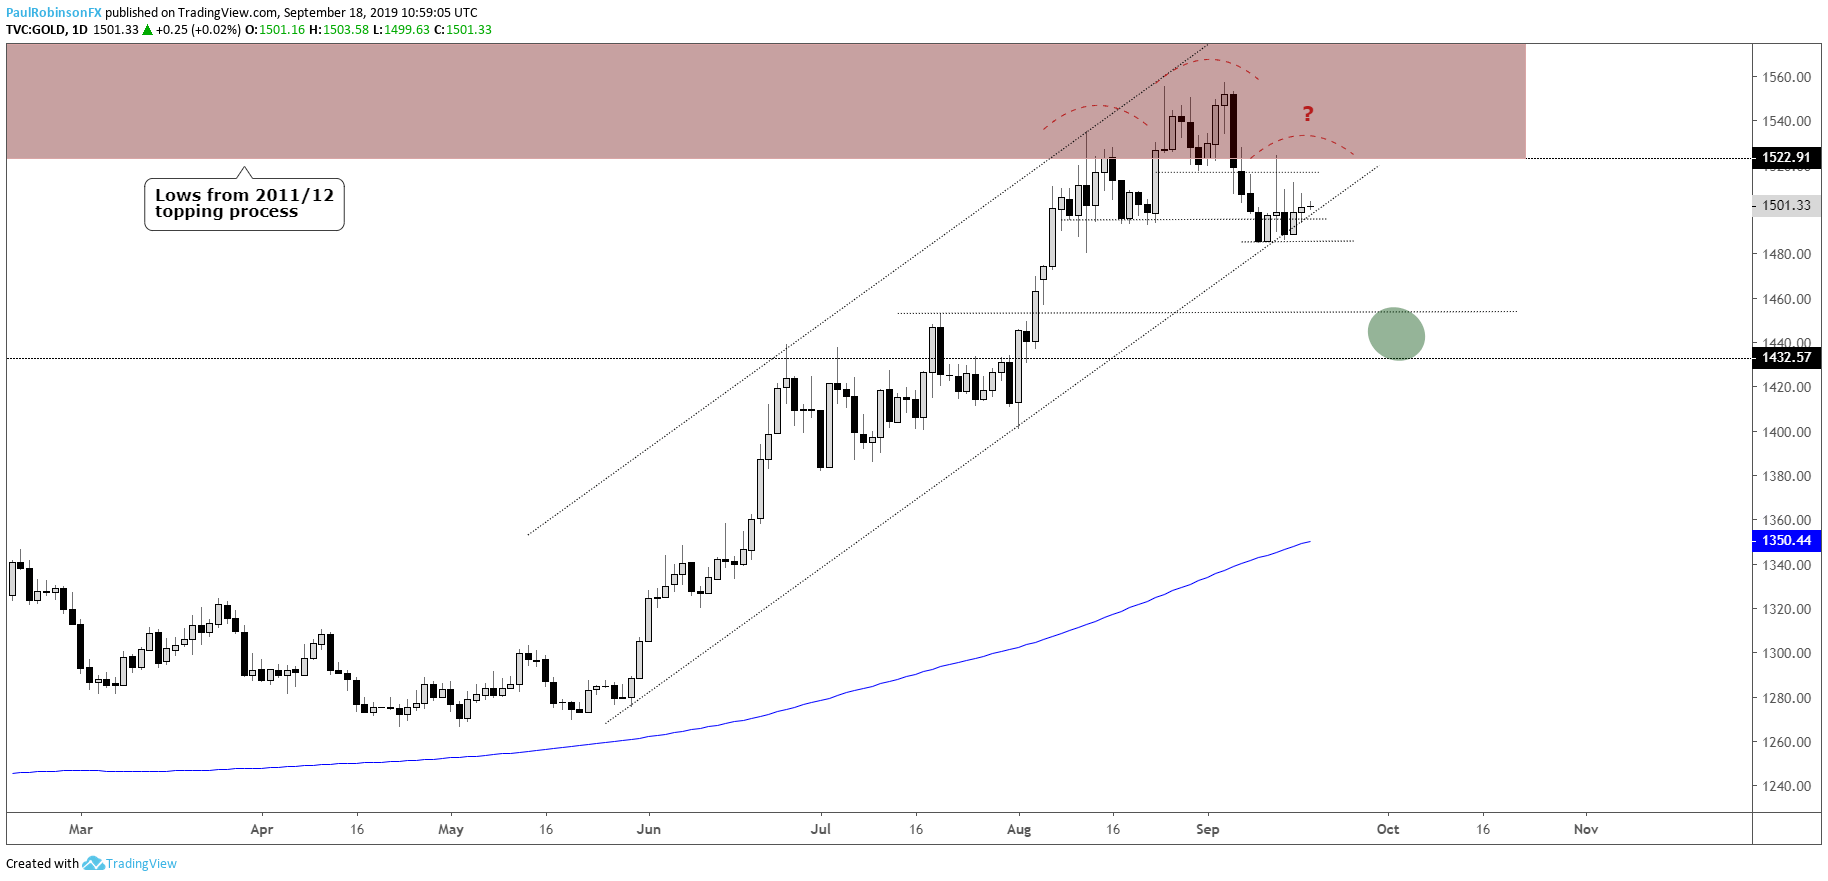
The head-and-shoulders (H&S) pattern under development is nearly ready to trigger, if indeed it is to do so. The neckline is pegged at 1484, also the low from September 10. A trigger of the neckline will also have gold rolling lower below the lower parallel of the channel in place since late-May.
The pattern is set up nicely with all points of the pattern (left shoulder, head, right shoulder) forming at the aforementioned zone of resistance. All that is needed is a break to confirm. Should we see a confirmed break then look for a break to the vicinity of ~1453/32. Heads up: Today is the FOMC meeting, could very well be the event that trips the trigger, so be prepared.
If, however, we don’t in fact see a breakdown and price rallies, gold still has its work cut out for it before it can get into the clear again to keep on moving higher. It won’t be in the clear again until it climbs over 1575. It could take some more time and digestion before that happens.
Taking the entire technical landscape into consideration, the path lower is considerably cleaner than the one towards higher prices. At least in the near-term. Looking longer-term, the multi-year breakout in June still looks like it has legs. More short-term weakness may set up traders looking for longer-term holds with the best chance in quite some time to be buy. More on that later…
Check out the IG Client Sentiment page to see how changes in trader positioning can help signal the next price move in gold and other major markets and currencies.
Gold Price Weekly Chart (major long-term resistance)
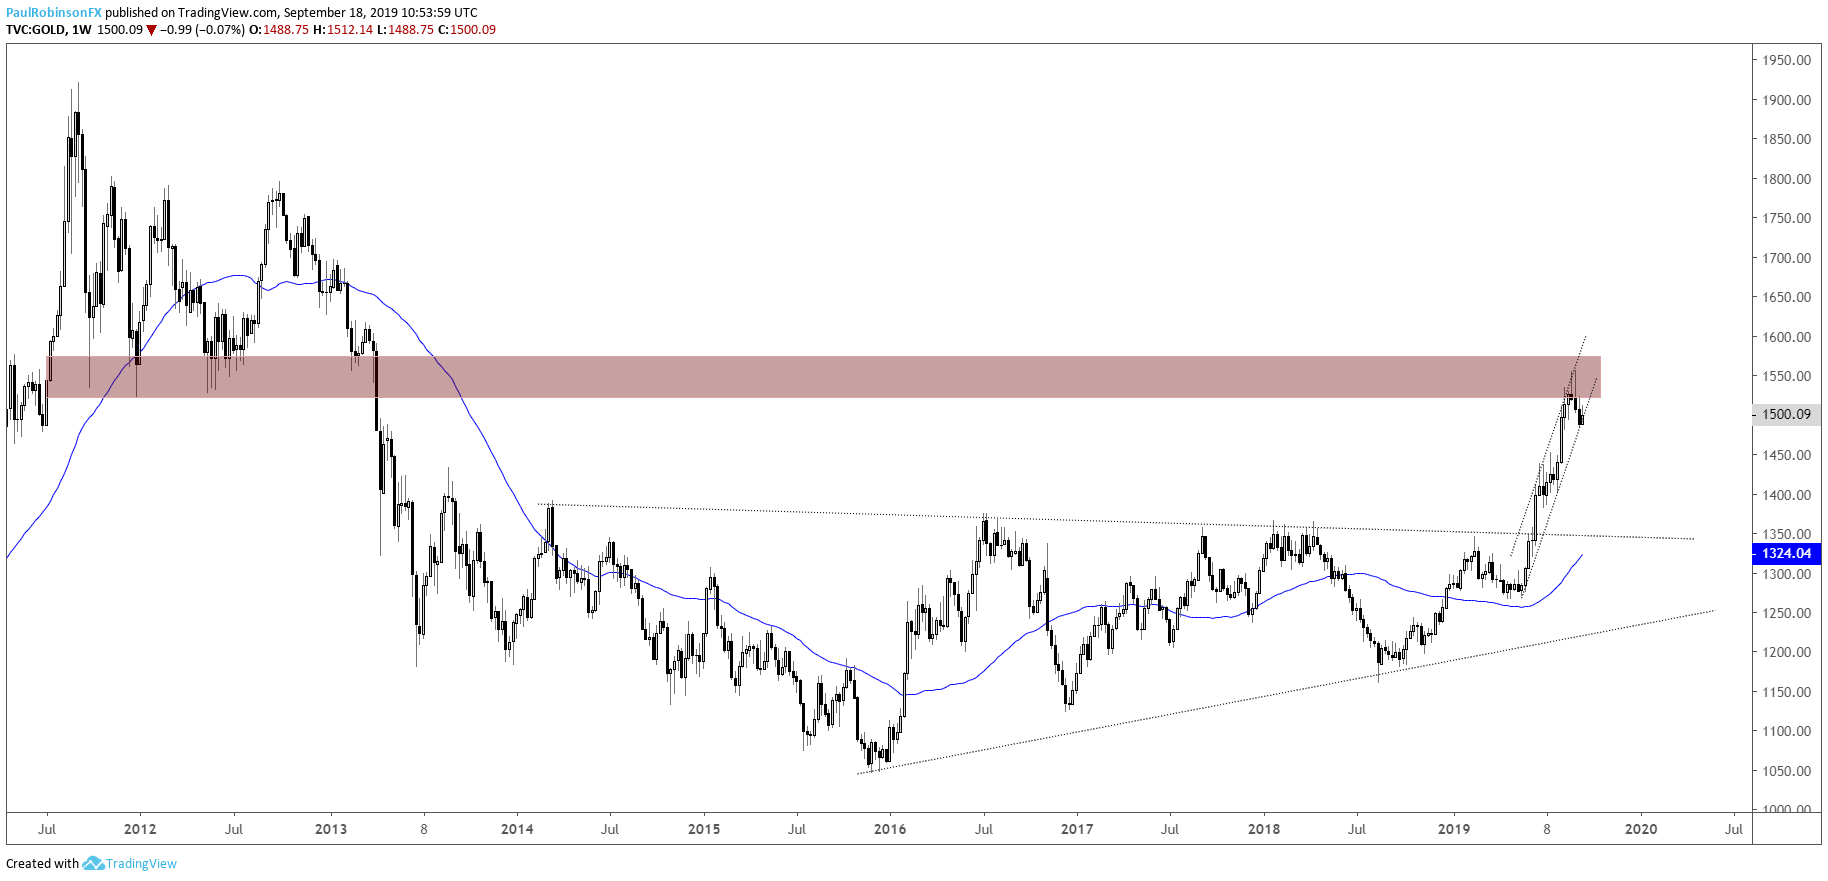
Gold Price Charts by Tradingview
Gold Price Daily Chart (H&S, channel support)
Resources for Forex & CFD Traders
Whether you are a new or experienced trader, we have several resources available to help you; indicator for tracking trader sentiment, quarterly trading forecasts, analytical and educational webinars held daily, trading guides to help you improve trading performance, and one specifically for those who are new to forex.
---Written by Paul Robinson, Market Analyst
You can follow Paul on Twitter at @PaulRobinsonFX