

GBP/USD and GBP/JPY charts and analysis
- British Pound price action against US Dollar and Japanese Yen.
Download for free our latest Q3 trading guidesto help you build confidence when you trade on JPY, USD and other main currencies
Sterling Pound Price – Slowing Uptrend Momentm
On Monday, GBP/USD rallied to 1.2385 – its highest level in over six weeks. However, the price slipped back pausing the uptrend move. In turn, GBP/JPY raised today to 133.38 reflecting the bullish outlook of the pair at this stage.
On Sep 4, the Relative Strength Index (RSI) crossed above 50 on both pair however, the oscillator remained flat nearby 57 reflecting a stalled upward momentum on GBP/USD meanwhile (RSI) climbed slightly from 57 to 62 highlighting a slowing impulse of the uptrend move on GBB/JPY.
Just getting started?See our Beginners’ Guide for FX traders
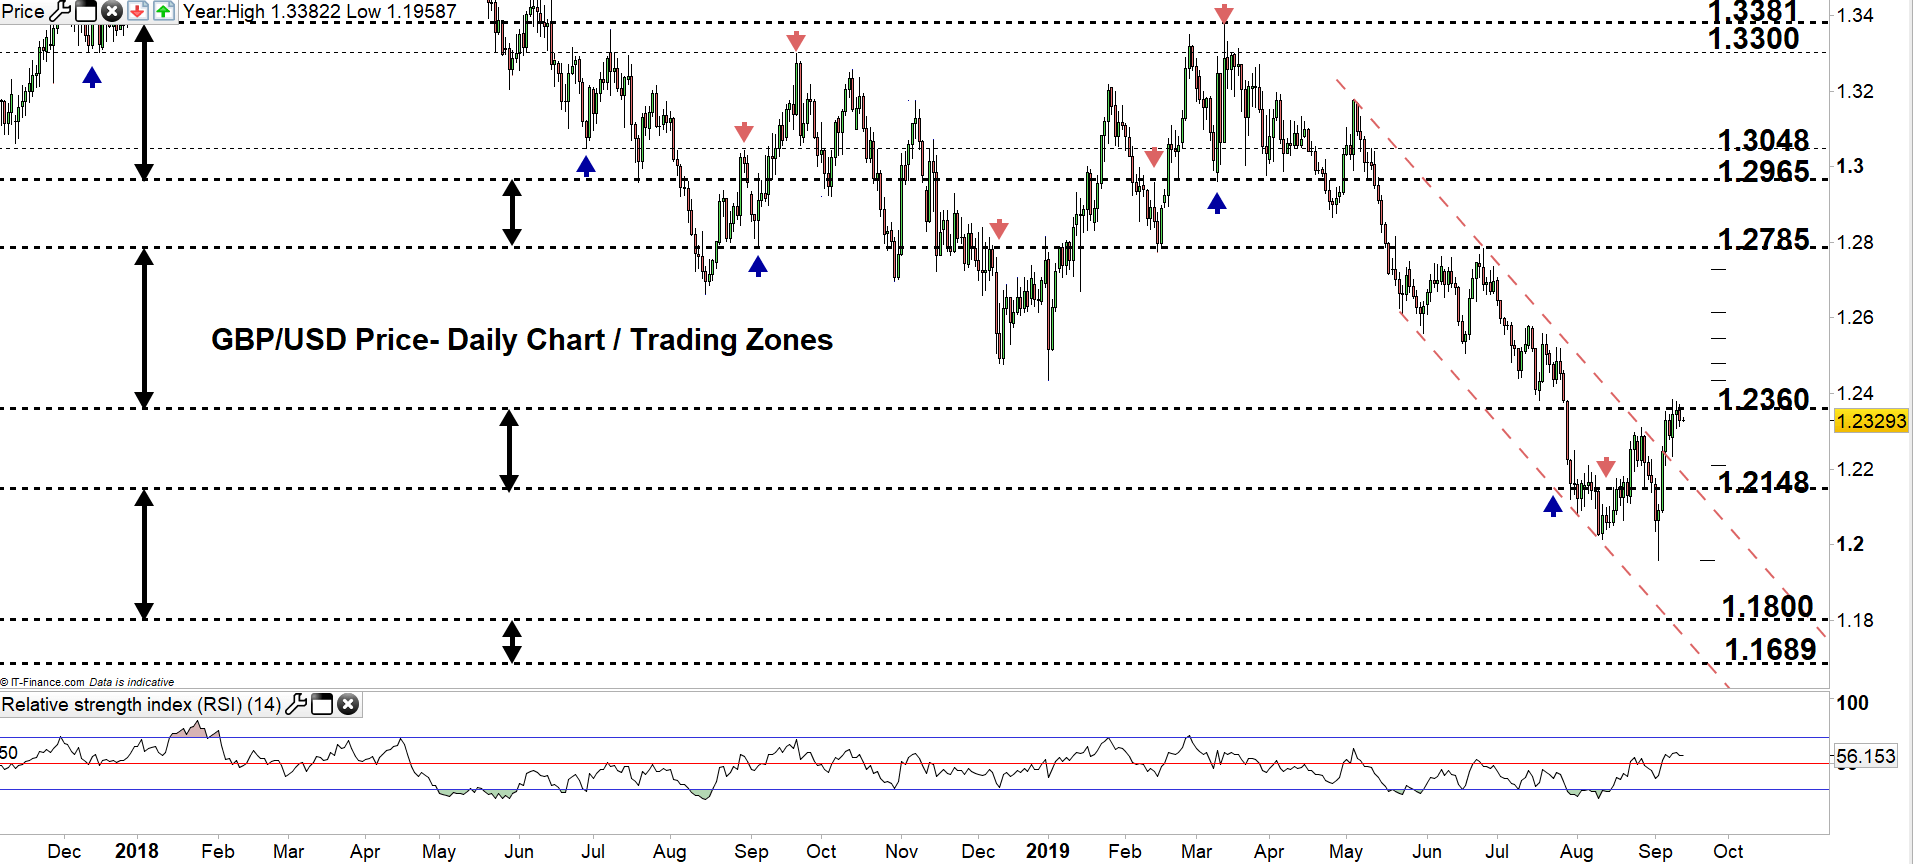
GBP/USD DAILY PRICE CHART (Nov 15, 2017 – sep 12, 2019) Zoomed out
GBP/USD DAILY PRICE CHART (May 1 – Sep 12, 2019) Zoomed IN

Looking at the daily chart, we notice on Sep 4 GBP/USD moved to a higher trading zone 1.2148 – 1.2360, then in the following day broke above the downtrend channel. The price tested the high end of the zone however, failed in multiple occasions to close above and move to a higher trading zone, indicating to buyer’s hesitation to continue pushing higher.
Therefore, the price could be on its way for a test of the low end of the zone contingent on clearing the weekly support level underlined on the chart. Further close below the low end may see GBP/USD trading even lower towards 1.1800. In that scenario, the weekly support level underscored on the chart (zoomed in) would be worth monitoring.
On the flip-side, any successful close above the high end of the zone could lead GBP/USD towards 1.2785. Although, buyers would need to watch closely the weekly resistance levels underlined on the chart, with special attention to 1.2616.
Having trouble with your trading strategy? Here’s the #1 Mistake That Traders Make
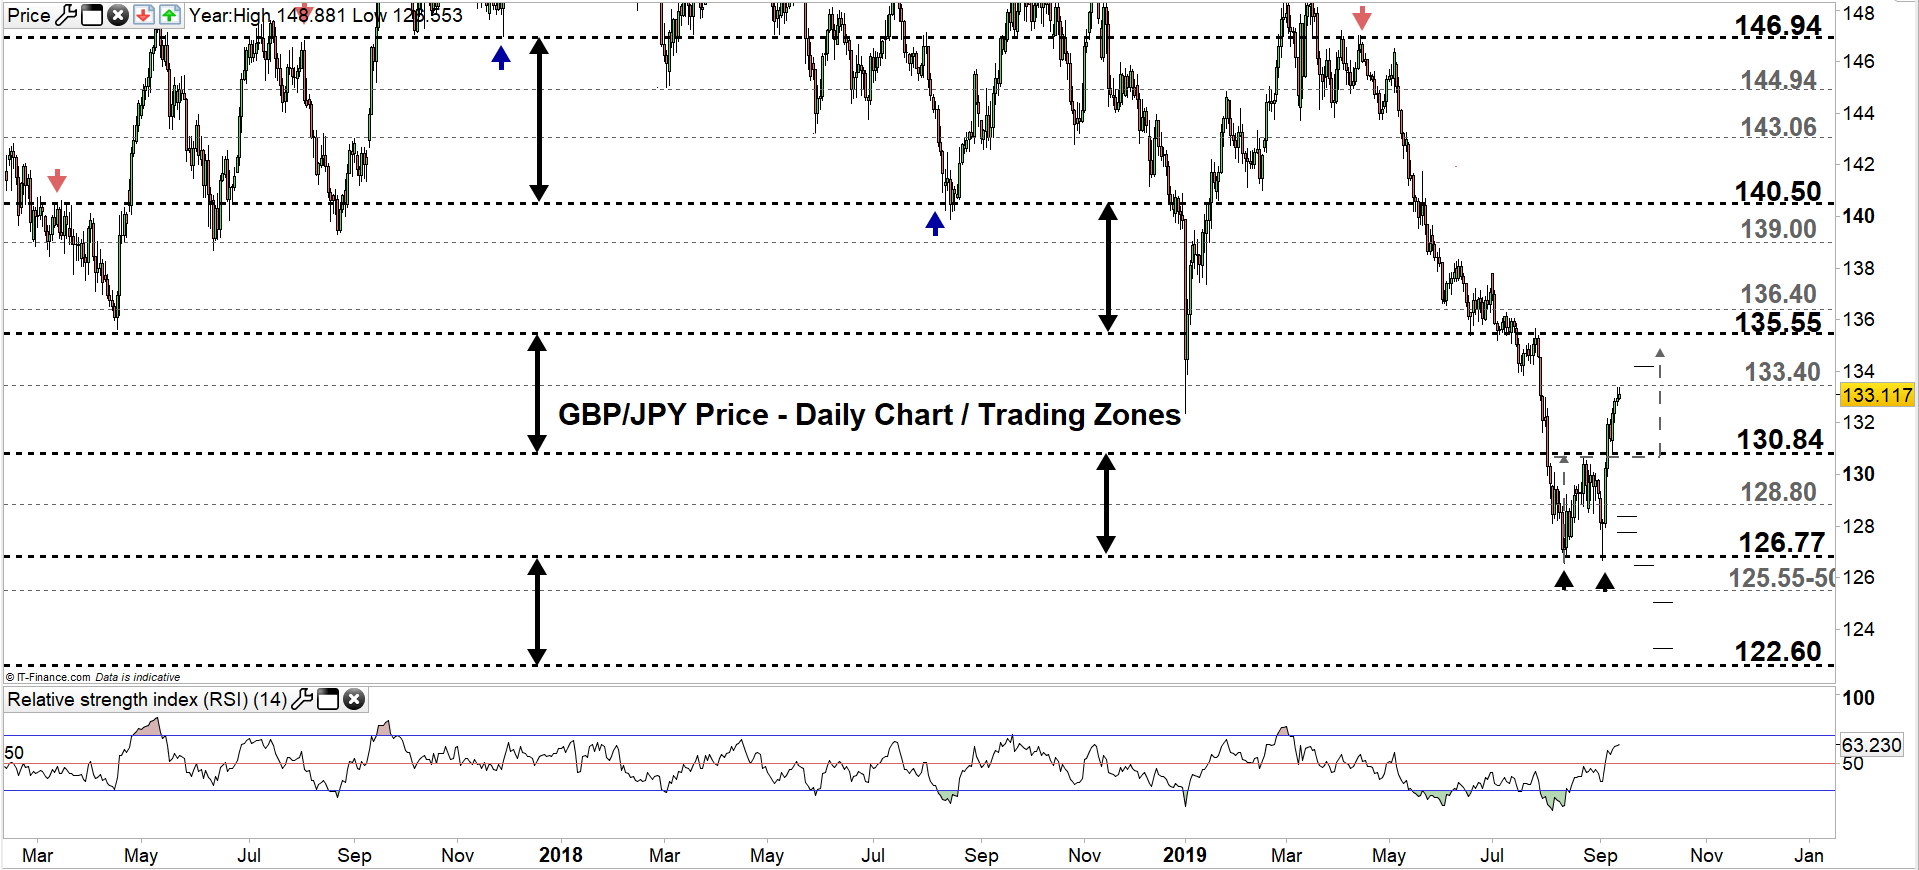
GBP/JPY DAILY PRICE CHART (FEB 20, 2017 – SEP 12, 2019) Zoomed out
GBP/JPY DAILY PRICE CHART (Aug7 – SEP 12, 2019) Zoomed in

From the daily chart, we notice on Sep 5 GBP/JPY broke above 130.70- the neckline of double bottom pattern discussed in our last update. Additionally, the pair rallied to a higher trading zone 130.84 – 133.40.
Hence, a close above the high end of the zone could send GBP/JPY towards 135.55. Although, the weekly resistance level underlined on the chart (zoomed in) with 134.85 should be watched along the way. Further close above 135.55 could push the price towards 136.40. That said, the weekly level marked on the chart should be considered.
On the other hand, any failure to close above the high end may reverse the pair’s direction and send it back towards the low end. Further close below the low end could press GBP/JPY towards 128.80. Nonetheless, the weekly support levels underlined on the chart need to be followed closely.
Written By: Mahmoud Alkudsi
Please feel free to contact me on Twitter: @Malkudsi