
EUR/USD Elliott Wave Analysis Points To Higher Levels

After a two-month grind towards lower levels, EUR/USD has shot higher. We were anticipating the bounce during the sell off at a bounce to 1.17 and possibly higher. Now that EUR/USD has continued to rise, it appears poised to retest its 1.2060 highs make a run at 1.22.
The Elliott Wave models we are following suggest a dip in prices may occur first prior to a 1.2060 retest. This dip in EUR/USD may move down to the 1.18 level. From there, the models diverge with some pointing to higher levels and others suggesting a deeper set back to near 1.17.
Through the lens of standard trend lines, EUR/USD is retesting the bottom side of a parallel trend line in place since early 2017. If the market can comfortably move above this level, then the door is open towards new highs.
Struggling to trade EUR/USD? This could be why.
Idealized Elliott Wave Flat Pattern on EUR/USD
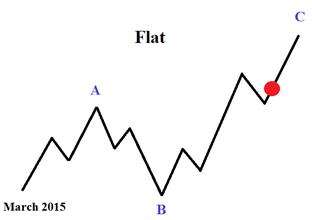
Here is the skinny on the Elliott Wave count. The November low represents the fourth wave low of a five wave impulsive sequence. The fifth wave began November 6 and represents a terminal wave at two degrees of trend. That means once this fifth wave exhausts to the upside, it will also exhaust the ‘C’ wave of a large expanded flat pattern that began March 2015. This implies an important top for EUR/USD, but we are not there yet.
EUR/USD Elliott Wave Count November 27
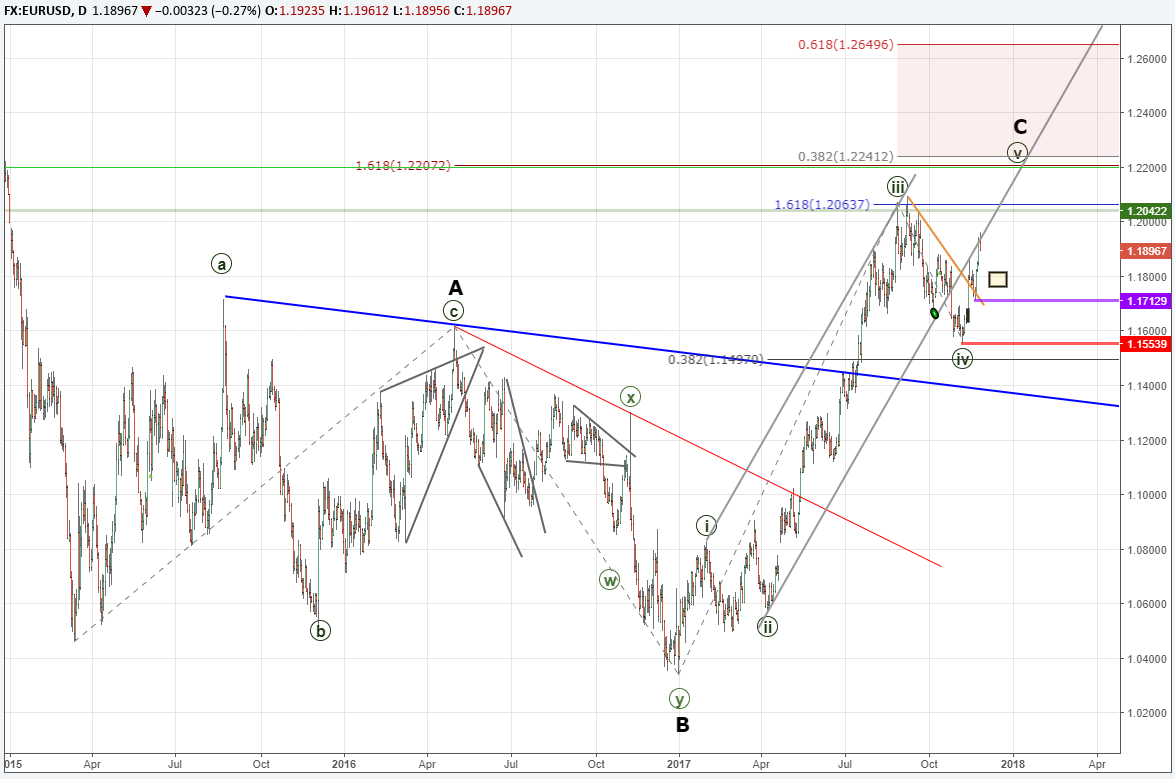
We can use wave relationships to provide targets for a fifth wave higher. These are guidelines and it does not mean EURUSD has to move to these levels. It does keep the door open that higher prices are still available to EURUSD.
There is a cluster of wave relationships showing up near 1.22.
- The 50% retracement of the 2014 downtrend is near 1.2205
- The ‘C’ wave of the flat pattern is 1.618 times the length of the ‘A’ wave near 1.2207.
- Circle wave ‘v’ is .382 times the distance of circle waves ‘i’ through ‘iii’ near 1.2241
With several different wave relationships near 1.22, should EURUSD enter that zone, it could mean an important top.
The sentiment picture continues to support bullish patterns. The current sentiment reading is -2.3 with the net short traders growing. This serves as a bullish sentiment signal. View the live sentiment reading to keep on top of any changes that may occur.
Therefore, so long as EURUSD is above 1.1553, we will maintain a bullish bias towards 1.22. In the short term, EURUSD may dip down to 1.17 or 1.18 and therefore we will look for a buy the dip strategy.
Are you new to trading the FX market? This guide was created just for you.
Want to learn more about Elliott Wave analysis? Grab the Beginner and Advanced Elliott Wave guides and keep them near your computer.
---Written by Jeremy Wagner, CEWA-M
Jeremy is a Certified Elliott Wave analyst with a Master’s designation. This report is intended to help break down the patterns according to Elliott Wave theory.
For further study on Elliott Wave impulse patterns, watch this webinar recording.
Discuss this market with Jeremy in Monday’s US Opening Bell webinar.
The November 27 recording of the US Opening Bell webinar can be viewed at this link.
Follow on twitter @JWagnerFXTrader .
Join Jeremy’s distribution list.
Challenges And Rewards Of Expat Life In Asia
The freedoms, novelties, and richness of new experiences that typify the expat way of living constitute the crux of the ... Read more
NZD/USD Wedge Breakout Back In Play As US Dollar Strength Cools
NZD/USD is looking higher ahead of Australian and New Zealand inflation expectations. Meanwhile, China's credit conditio... Read more
Australian Dollar Outlook: AUD/USD Eyes Westpac Consumer Confidence
The Australian Dollar is seeing a mild rebound following a Rising Wedge breakdown. AUD/USD may see volatility on Westpac... Read more
NZD/USD May Weaken As Goldman Sachs Downgrades Chinese Growth Outlook
The New Zealand Dollar fell overnight against the US Dollar as Covid and Chinese economic downgrades weighed on sentimen... Read more
AUD/USD Threatens Key Technical Level As Chinese Inflation Data Nears
AUD/USD is threatening a breakdown as prices test support at the floor of a Rising Wedge chart pattern. Chinese inflatio... Read more
Australian Dollar Forecast: AUD/USD May Move On RBA, Covid, China, US NFPs
The Australian Dollar is benefiting from a rebound in sentiment after Wall Street closed higher. AUD/USD looks to the RB... Read more