
Ethereum Elliott Wave Analysis: Triangle Pattern Shows 5th Wave Rise

Ethereum Elliott Wave Analysis Talking Points:
- Recent Ethereum price corrections allow us to focus on the technical patterns forming in the charts
-Ethereum appears to have carved an Elliott Wave triangle in the fourth position of a five wave impulse
-Get started learning about trading Ethereum using the Elliott Wave with our beginner and advanced Elliott Wave trading guide.
The Elliott Wave model on Ethereum (ETH) appears to have finished a triangle pattern. The triangle pattern is one that helps me start an Elliott Wave count because it appears only in certain areas of the Elliott Wave sequence.
In the case for Ethereum, the exponential rise then December 2017 correction hints the triangle is in the fourth wave position of an impulse wave. That essentially means the triangle pattern is interrupting the uptrend.
Ethereum chart shows continued rise in an impulse wave
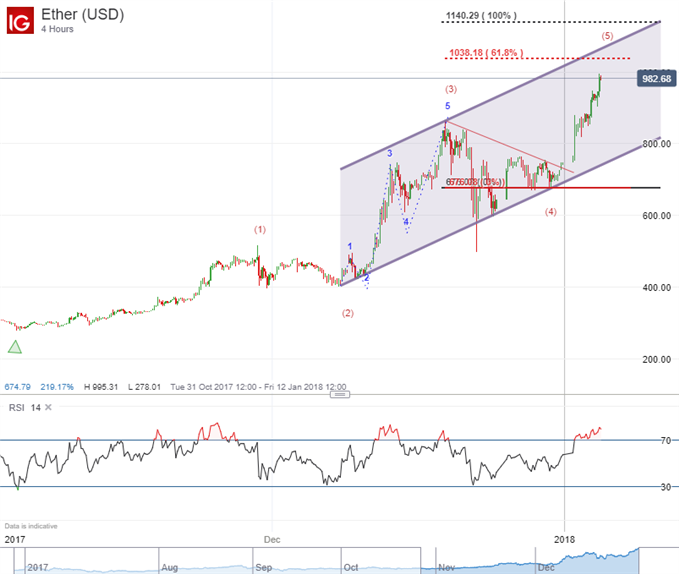
Since the triangle appears to be in the fourth wave of a five wave impulse that implies this current rise is a fifth wave. After this wave finishes, a correction back into the triangle’s price territory is not out of the question.
Applying some fifth wave measuring techniques, wave relationships begin forming near $1038. For example, $1038 is the Ethereum price chart level where wave 5 is 61.8% the length of waves 1-3. Additionally, there is channel resistance forming near $1075. The channel is created by drawing a trend line at the end of waves two and four, duplicating that line, and place it at the top of wave three.
Remember, these levels are areas of wave relationships. We are not suggesting prices have to stop at these levels nor are we implying that price will reach these levels. These are levels that can provide estimates for fifth waves in an impulse wave sequence. If our analysis of the waveform is correct, then we are anticipating Ethereum to slow its ascent near $1038 to $1075.
Elliott Wave Theory FAQs
What is the Elliott Wave Theory?
Elliott Wave Theory is a forex trading study that identifies the highs and lows of price movements on charts via wave patterns. Traders often analyse the 5-wave impulse sequence and 3-wave corrective sequence to help them trade forex strategically.
How to use the Elliott Wave principle to trade
Download our beginners or advanced trading guide to learn how to learn expert tips to trade with the Elliott Wave formula.
New to trading cryptocurrencies? Our introductory cryptocurrency trading guide will help you get started.
The cryptocurrency market can be confusing. Especially lately with the rise of altcoins garnering more attention. The DailyFX Bitcoin Glossary can help provide traders with some definition to common cryptocurrency terms.
---Written by Jeremy Wagner, CEWA-M
Jeremy Wagner is a Certified Elliott Wave Analyst with a Master’s designation. Jeremy provides Elliott Wave analysis on key markets as well as Elliott Wave educational resources. Read more of Jeremy’s Elliott Wave reports via his bio page.
Discuss this market with Jeremy in Monday’s US Opening Bell webinar.
Follow on twitter @JWagnerFXTrader .
Join Jeremy’s distribution list.
Recent Elliott Wave articles by Jeremy:
2018 Forecast for EUR/AUD, GBP/AUD and AUD/JPY
Can Swiss Franc Outperform its Peers in 2018?
Bulls Excited About GBP/JPY Longer Term Elliott Wave Pattern
Elliott Wave Analysis: Crude Oil Price Bursts Higher in 5th Wave
Challenges And Rewards Of Expat Life In Asia
The freedoms, novelties, and richness of new experiences that typify the expat way of living constitute the crux of the ... Read more
NZD/USD Wedge Breakout Back In Play As US Dollar Strength Cools
NZD/USD is looking higher ahead of Australian and New Zealand inflation expectations. Meanwhile, China's credit conditio... Read more
Australian Dollar Outlook: AUD/USD Eyes Westpac Consumer Confidence
The Australian Dollar is seeing a mild rebound following a Rising Wedge breakdown. AUD/USD may see volatility on Westpac... Read more
NZD/USD May Weaken As Goldman Sachs Downgrades Chinese Growth Outlook
The New Zealand Dollar fell overnight against the US Dollar as Covid and Chinese economic downgrades weighed on sentimen... Read more
AUD/USD Threatens Key Technical Level As Chinese Inflation Data Nears
AUD/USD is threatening a breakdown as prices test support at the floor of a Rising Wedge chart pattern. Chinese inflatio... Read more
Australian Dollar Forecast: AUD/USD May Move On RBA, Covid, China, US NFPs
The Australian Dollar is benefiting from a rebound in sentiment after Wall Street closed higher. AUD/USD looks to the RB... Read more