

Dow/S&P 500/NDX Outlook:
- Indices significantly above long-term MAs, pullback risk high
- It may not mark ‘the’ top, but should give traders some volatility to trade
Indices significantly above long-term MAs, pullback risk high
On Friday, I discussed the potential for the Nasdaq Composite to treat the 10k threshold in 2020 as it did 5k back in 2000 – a major top. But before possibly seeing the 10k mark achieved we may first see a correction develop.
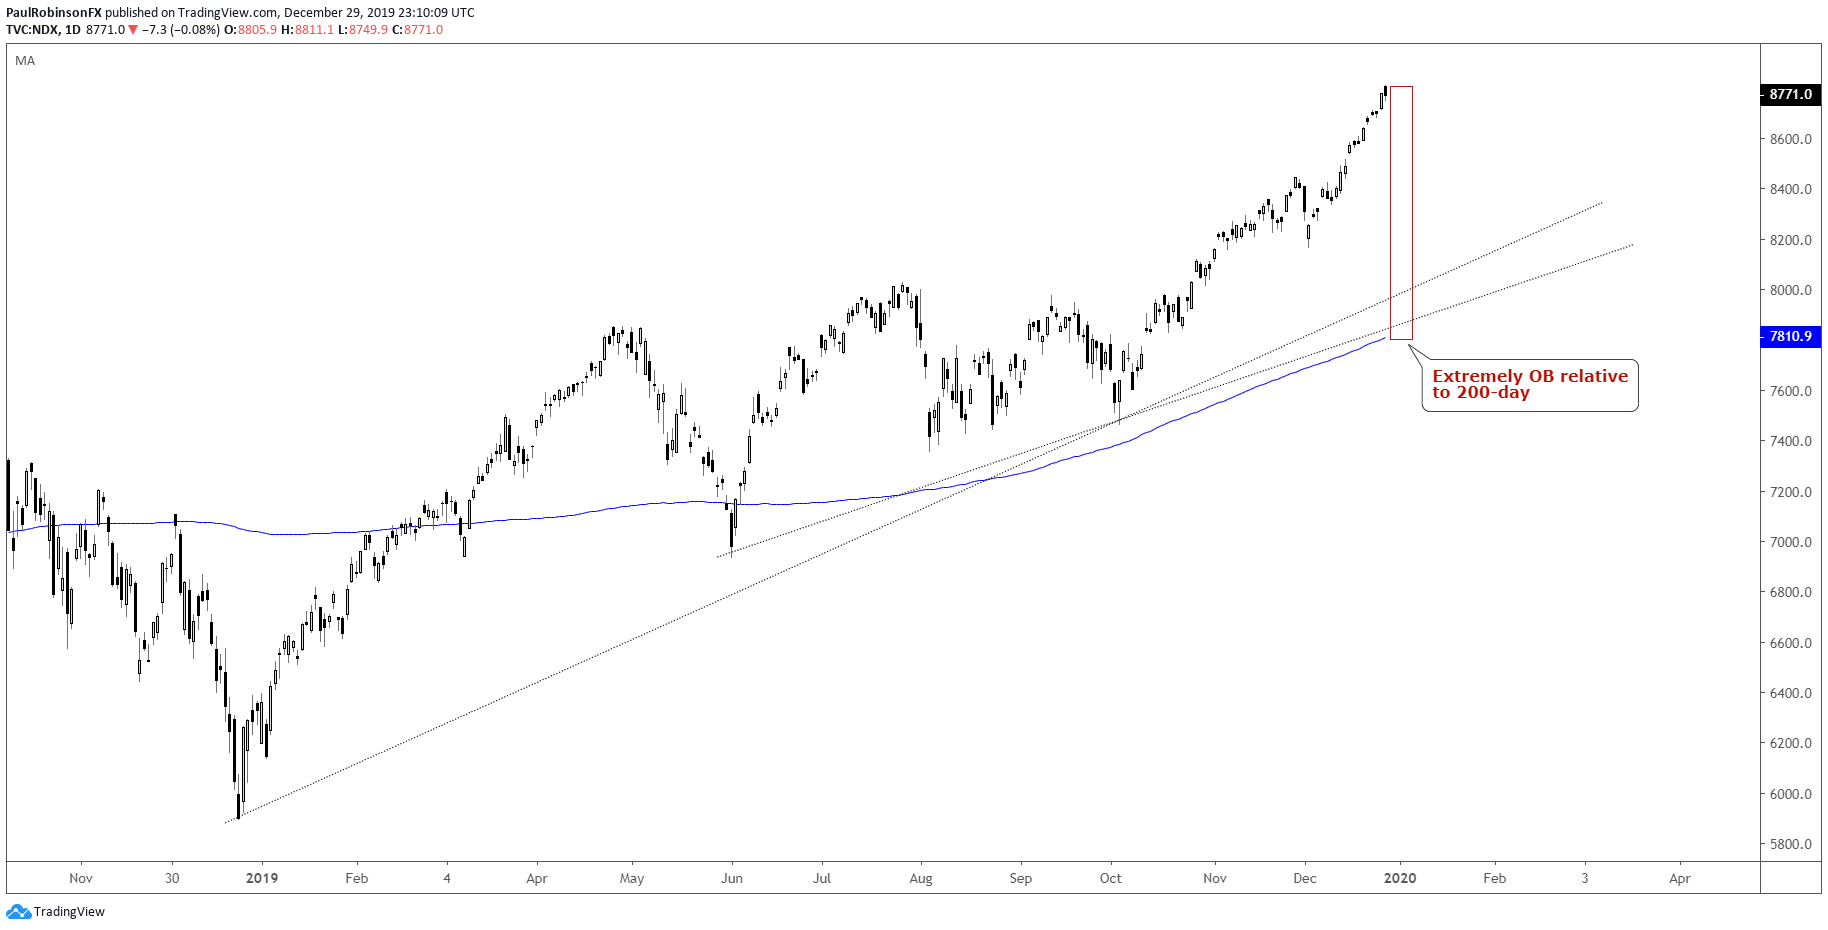
The NDX is currently trading nearly 2.7 standard deviations above the 200-day MA, an impressive feat to say the least. Only about 0.6% of days since the 2009 low has the index traded at such an extreme to the long-term moving average. Each time extremes of this magnitude were record it not long after coincided with a corrective move. The last instance was in January 2018.
The S&P 500 and Dow Jones are sitting in similar situations to a slightly lesser degree. A reversion back towards the 200-day MA seems reasonable given where we are today. It is possible some of the overbought conditions are worked off via time, but there is almost certainly going to be some relatively steep losses as part of the corrective sequence that give shorts the upper hand.
But before going out and trying to pick a top, it’s a good idea to wait for some confirming price action. That is, wait for a sudden break lower that indicates a willingness by market participants to hit the bid, something we have seen none of lately. We might be near a pullback in terms of time, but the final push higher can be sharp and painful if caught on the wrong side.
With a sudden break and downside price action, higher volatility will help give better traction for those traders looking to take advantage of short-term swings. Given that January often brings a lot of participation and the market is primed to move, the next few weeks could be an exciting frame.
Nasdaq 100 Daily Chart (Extremely overbought vs 200-day)
To learn more about U.S. indices, check out “The Difference between Dow, Nasdaq, and S&P 500: Major Facts & Opportunities.” You can join me every Wednesday at 1030 GMT for live analysis on equity indices and commodities, and for the remaining roster of live events, check out the webinar calendar.
Tools for Forex & CFD Traders
Whether you are a beginning or experienced trader, DailyFX has several resources available to help you; indicator for tracking trader sentiment, quarterly trading forecasts, analytical and educational webinars held daily, trading guides to help you improve trading performance, and one specifically for those who are new to forex.
---Written by Paul Robinson, Market Analyst
You can follow Paul on Twitter at @PaulRobinsonFX