

AUD/USD, Australian Dollar, US Dollar, Stock Markets – TALKING POINTS
- US Dollar selling pressure persisting despite a rising number of geopolitical risks
- Stocks rose after housing data showed remarkably better-than-expected statistics
- AUD/USD near multi-month swing-high as RSI divergence shows worrying signs
Wall Street equity markets mostly closed higher, with the S&P 500 and Nasdaq indexes up 0.23 and 0.73 percent, respectively. The latter closed at another all-time high and helped cement the narrative that the technology sector has disproportionately outperformed its peers in the pandemic. Meanwhile, the industrial-leaning Dow Jones closed 0.24 percent lower, with the overwhelming majority of losses in the energy sector.
In currency markets, the petroleum-linked Norwegian Krone along with the haven-linked US Dollar were the deepest in the red. Meanwhile, the Brexit-sensitive British Pound and growth-anchored New Zealand Dollar were the session’s champions. The former may have risen in part from optimism about EU-UK talks, with GBP/USD also being propelled by swelling selling pressure in the Greenback.
The exact catalyst behind the rise of equity markets on Tuesday is unclear, but a factor may be general market optimism despite a number of geopolitical roadblocks. Outstanding housing starts and building permits may have contributed to the initial rise on Tuesday, especially considering how that kind of data has far-reaching implications for the US economy. Read more about it here.
Wednesday’s Asia-Pacific Trading Session
Robust risk appetite may amplify Wall Street trade’s market dynamics, potentially setting up the US Dollar for another round of losses and giving a tailwind for AUD/USD ahead of a key technical level. NZD may rise along with commodities. Credit default swap spreads on sub-investment grade corporate debt may narrow and further amplify risk appetite.
AUD/USD Analysis
AUD/USD may attempt to grasp the January 2019 swing-high ledge at 0.7295 as the pair continues to add onto its +20 percent rise since bottoming out in March. Clearing that ceiling with follow-through may open the door to retesting another multi-month top at 0.7393. Having said that, negative RSI divergence is showing that upside momentum is slowing.
AUD/USD – Daily Chart
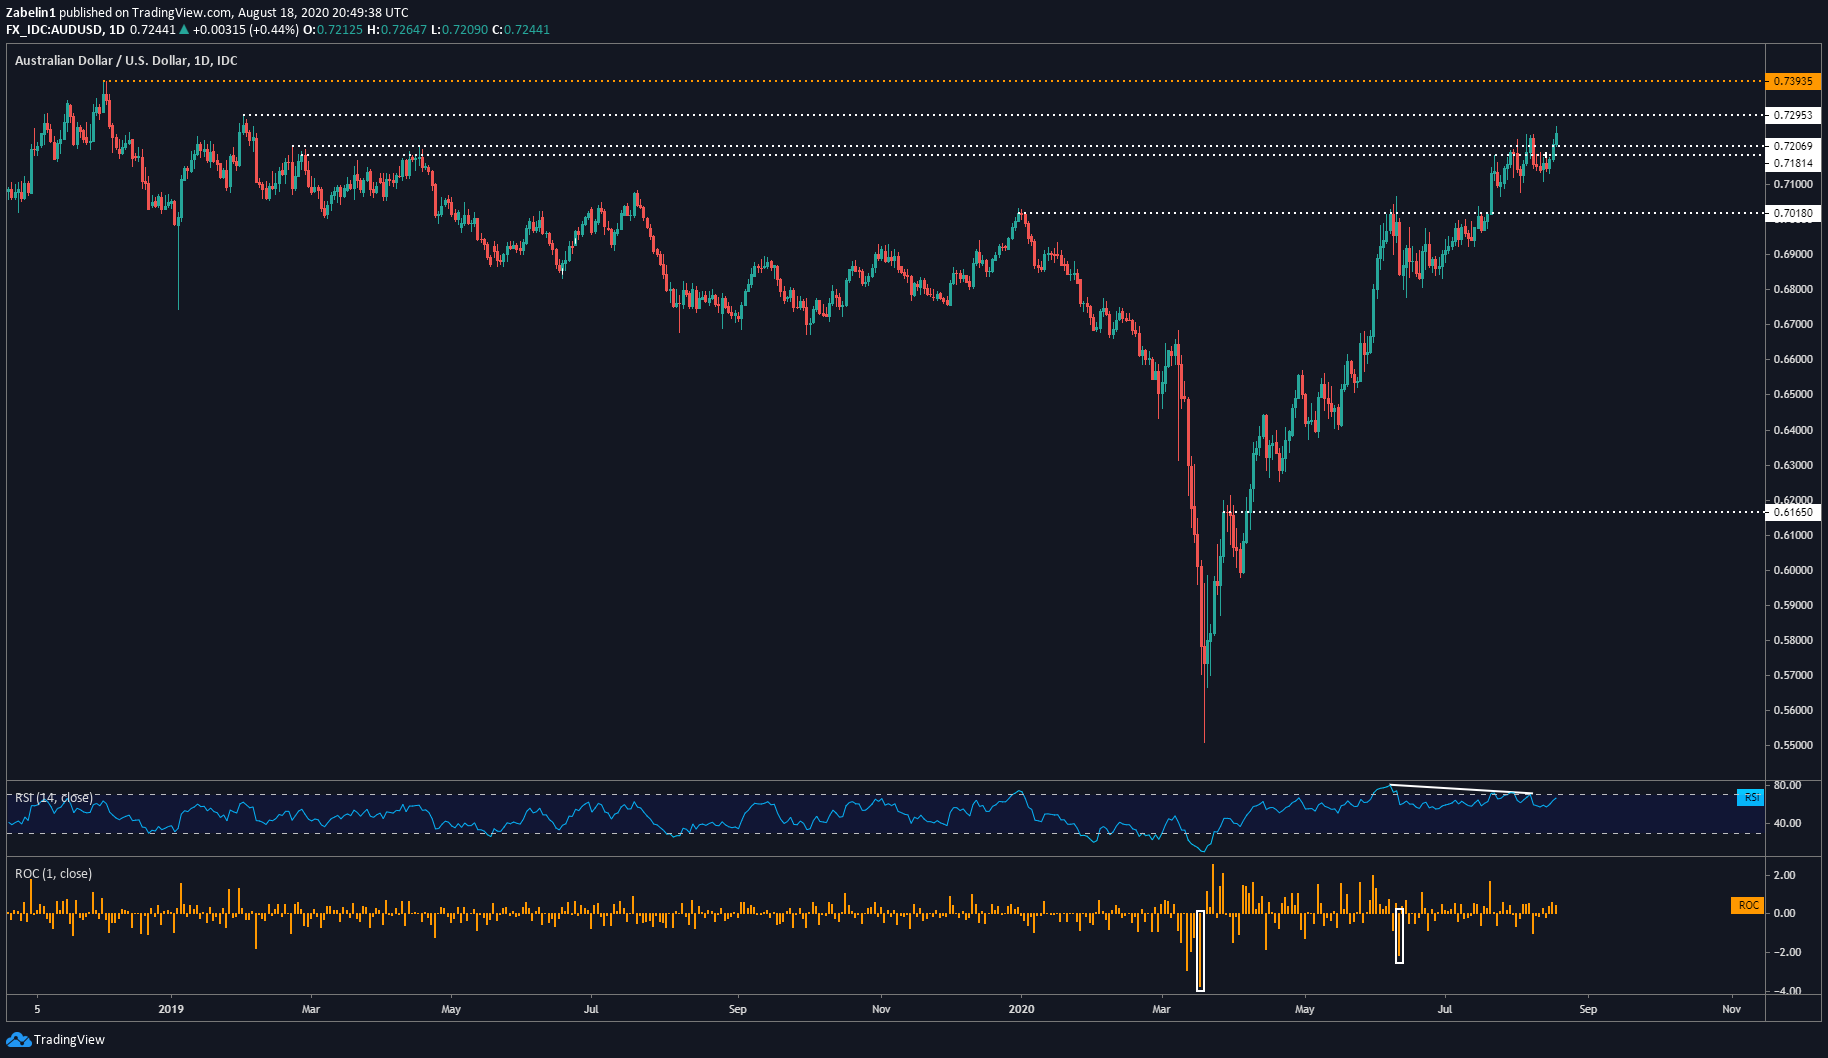
AUD/USD chart created using TradingView
While this does not necessarily suggest that a pullback is inevitable, its formation ahead of key resistance could make some traders nervous. Consequently, price action may become more timid as AUD/USD approaches it.
--- Written by Dimitri Zabelin, Currency Analyst for DailyFX.com
To contact Dimitri, use the comments section below or @ZabelinDimitri on Twitter