Hedera Hashgraph Price Rare Patterns Point To An HBAR Rebound

Hedera Hashgraph price has retreated sharply in recent days as the outlook for the crypto industry has worsened.
Hedera Hashgraph (HBAR) fell to a low of $0.2483, a drop that mirrored other popular cryptocurrencies like Bitcoin (BTC) and Ethereum (ETH). Most cryptocurrencies have dropped, bringing the total market capitalization of all coins to $3.24 trillion.
Hedera’s retreat coincides with a decline in the total value of assets locked in its decentralized finance ecosystem. According to DeFi Llama, the TVL has dropped to 675 million HBAR, down from the year-to-date high of 1.35 billion tokens.
In U.S. dollar terms, the TVL has fallen from $209 million on Dec. 3 to $165 million. This decline suggests that investors are pulling out funds from Hedera’s DeFi platforms like SaucerSwap, Bonzo Finance, and HbarSuite.
To be fair, Hedera is not the only blockchain network experiencing a decline in DeFi assets. Other popular chains like Cardano, Ethereum, and Solana have also seen capital flight in recent days. Historically, investors tend to exit these platforms during periods of broader cryptocurrency market weakness.
Despite the current downturn, Hedera Hashgraph has some positive fundamentals that could drive its price higher in the long term. The network boasts partnerships with major global companies like IBM and Google, both of which are members of its governance council.
Hedera is also positioning itself as a key player in the Real World Asset Real World Asset tokenization industry. Tokenization refers to converting illiquid assets into liquid ones that can be easily moved and traded. Hedera’s fast transaction speeds and low costs make it an attractive option for developers in this space.
Another potential catalyst for HBAR is the possibility of the Securities and Exchange Commission approving a spot HBAR ETF in 2025. According to a senior Bloomberg analyst, the SEC may approve the ETF since it does not classify HBAR as a security.

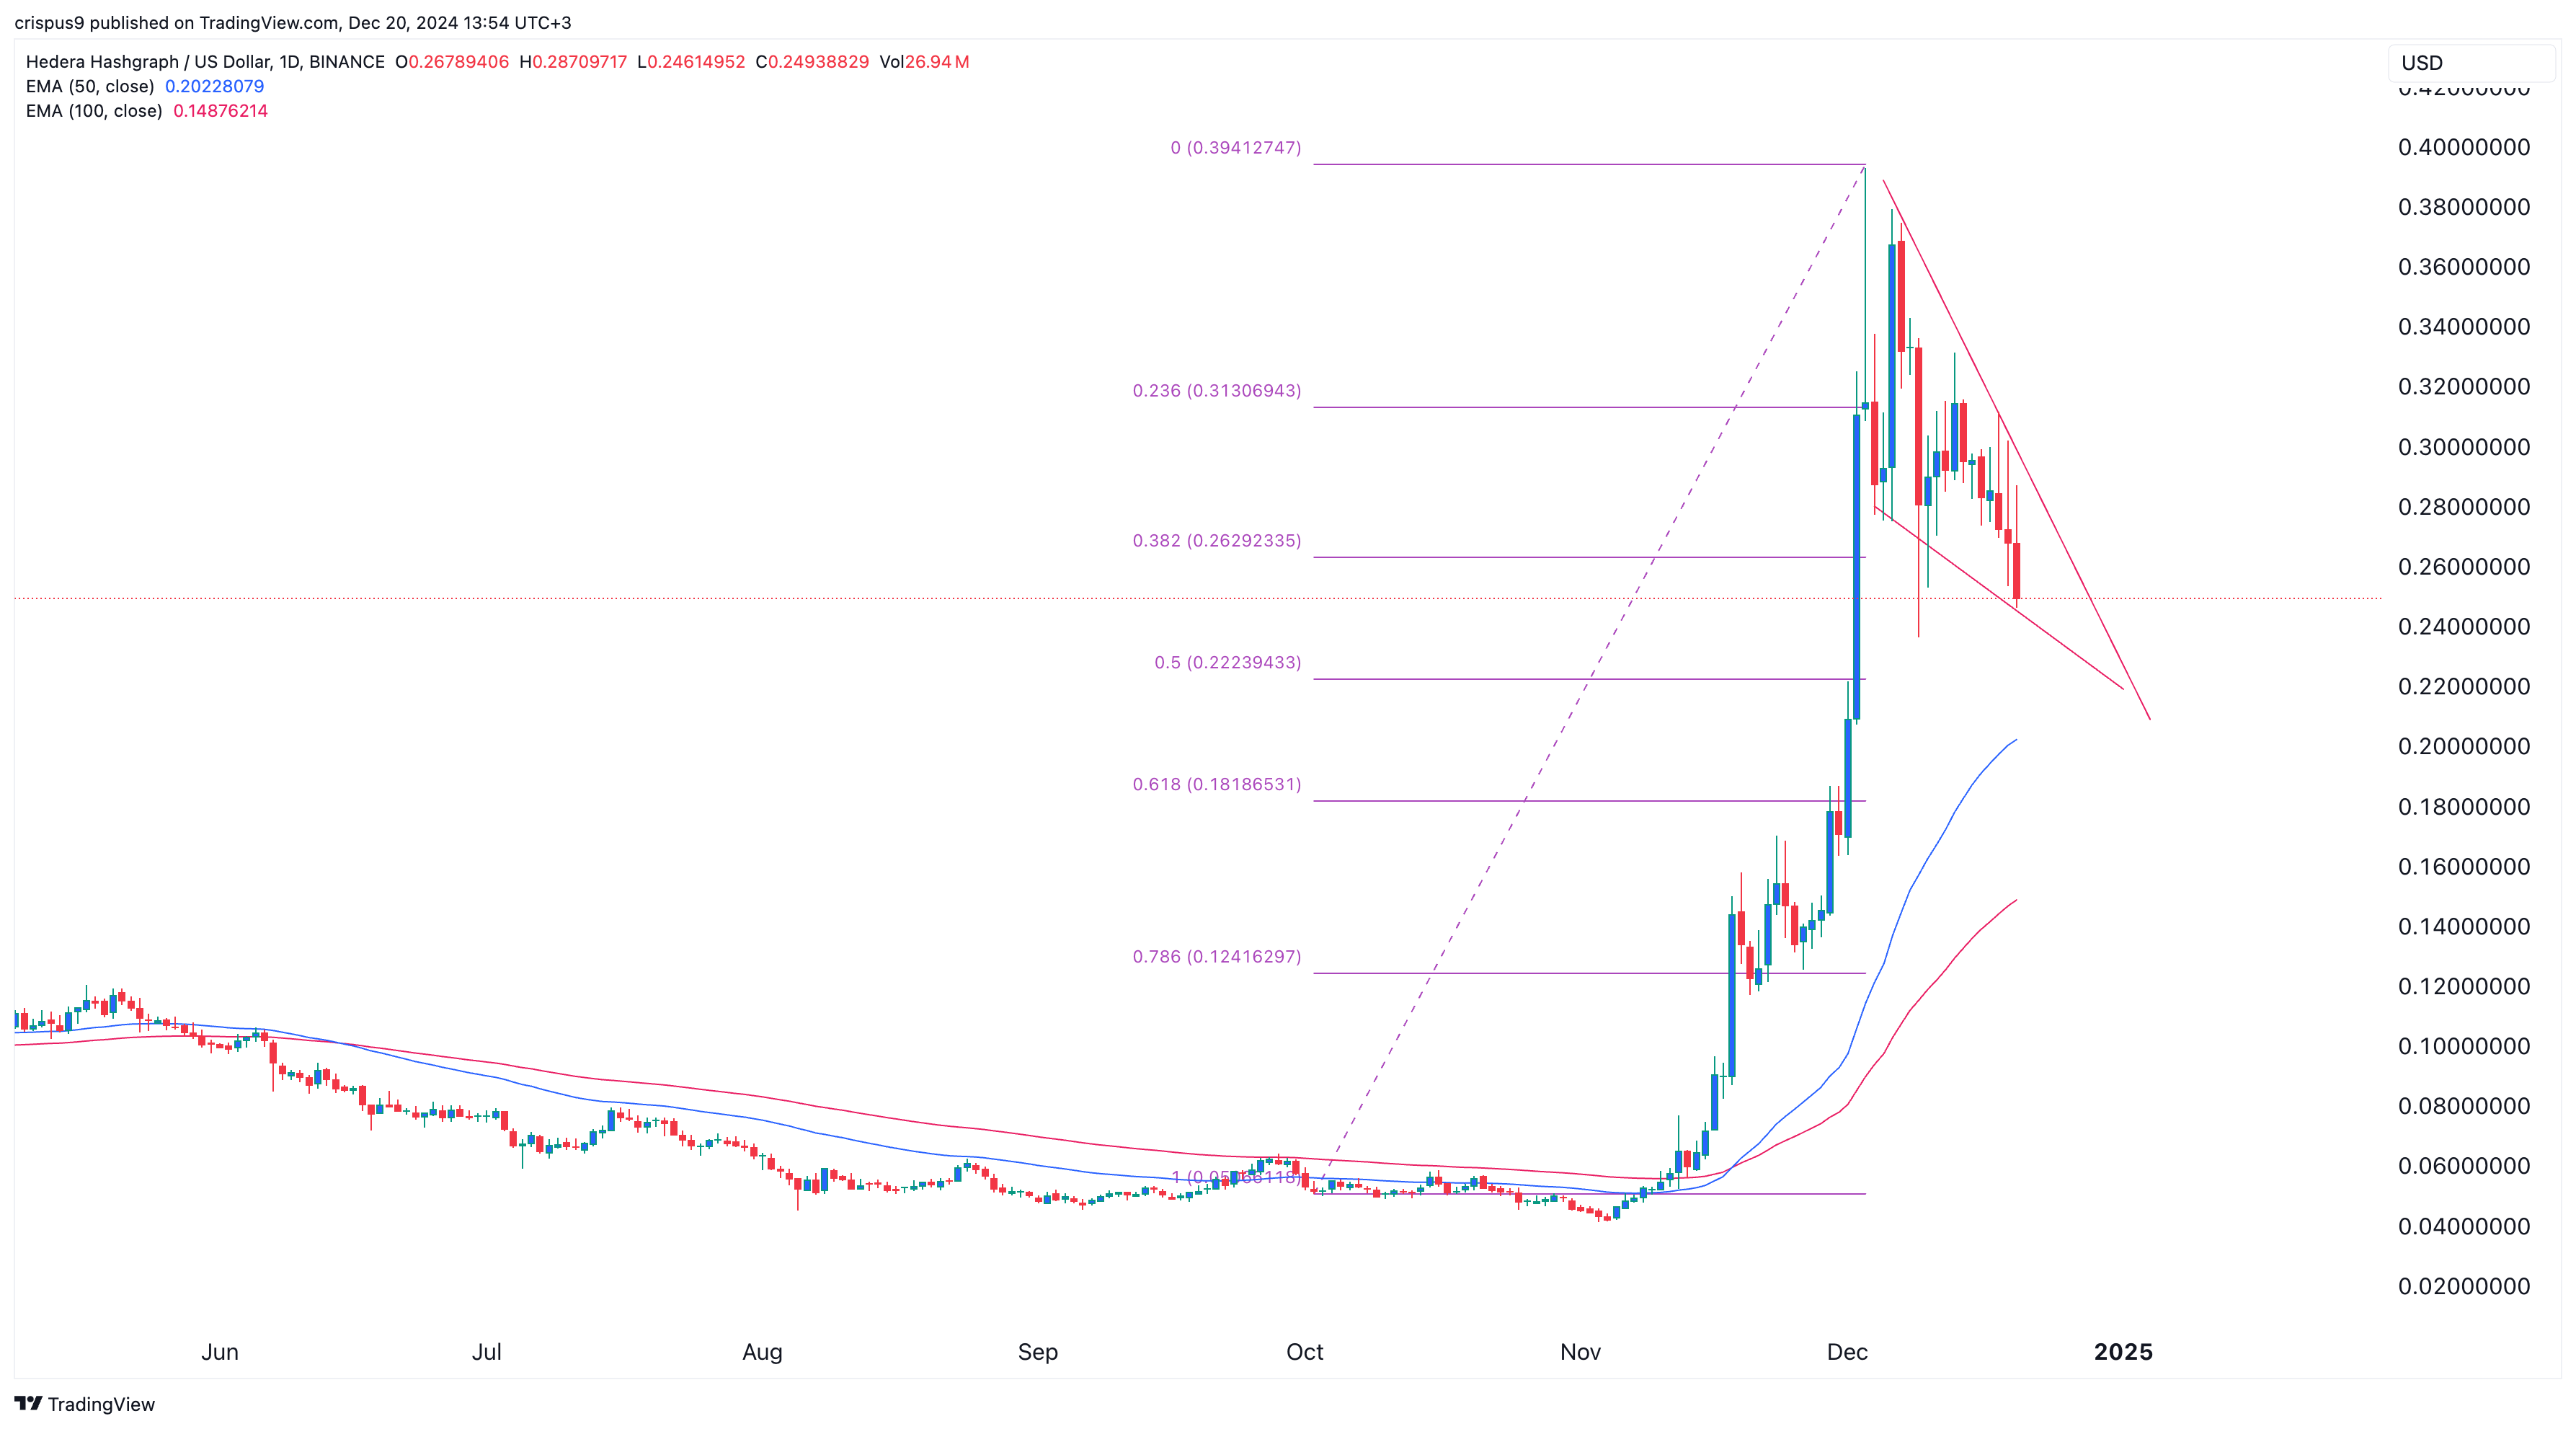
The daily chart shows that the HBAR price is forming a bullish chart pattern. Specifically, it is developing a falling wedge pattern, which typically forms as an asset consolidates between two falling trendlines. A bullish breakout often occurs when the two lines converge.
Additionally, Hedera is forming a bullish pennant pattern, characterized by a long upward trendline followed by consolidation. This pattern also often leads to a strong bullish breakout over time. HBAR remains above the 50-day moving average and the major support and resistance pivot point of the Murrey Math Lines at $0.1953.
Therefore, a contrarian case can be made for Hedera’s price. If the bullish patterns hold, HBAR could rebound and retest the year-to-date high of $0.3940, representing a potential gain of about 66% from the current level. However, the bullish outlook would be invalidated if the coin drops below the major S&R level at $0.20.
Crypto Firms Push Into US Banking
America’s cryptocurrency companies are scrambling to secure a foothold in the country’s traditional banking system, ... Read more
Ether Surges 16% Amid Speculation Of US ETF Approval
New York, USA – Ether, the second-largest cryptocurrency by market capitalization, experienced a significant surge of ... Read more
BlackRock And The Institutional Embrace Of Bitcoin
BlackRock’s strategic shift towards becoming the world’s largest Bitcoin fund marks a pivotal moment in the financia... Read more
Robinhood Faces Regulatory Scrutiny: SEC Threatens Lawsuit Over Crypto Business
Robinhood, the prominent retail brokerage platform, finds itself in the regulatory spotlight as the Securities and Excha... Read more
Ethereum Price Holds Five-year Range As Breakdown Risk Points To $950
The current Ethereum price is within a long-term five-year range and positioned below key volume levels, increasing the ... Read more
400 Million Coins Left: BlockDAGs $0.0005 Entry Price Is About To Vanish Forever
BlockDAG is entering its final presale hours at a fixed price of $0.0005, with only 400 million coins remaining before p... Read more

