3 Reasons Why Ethereum Price May Go Parabolic Soon

Ethereum has retreated for two consecutive weeks as concerns about weak demand and falling market share remain.
Ethereum (ETH) dropped to a low of $2,140 this week and bounced back to $2,620 as the crypto industry stabilized. It remains about 37% below its highest level in December last year.
Solana becomes formidable rival
DeFi Llama data shows that Ethereum’s 30-day trading volume was $95 billion compared to Solana’s (SOL) $264 billion.
Ethereum has also been overtaken in terms of fees this year. Its network has collected $172 million in fees, making it the sixth-most profitable cryptocurrency project after Tether, Tron, Jito, Solana, and Circle.
The price of ETH has also dropped due to ongoing Ethereum Foundation controversies and token dumps. Here’s why it could be ripe for a comeback:
Spot Ethereum ETF inflows
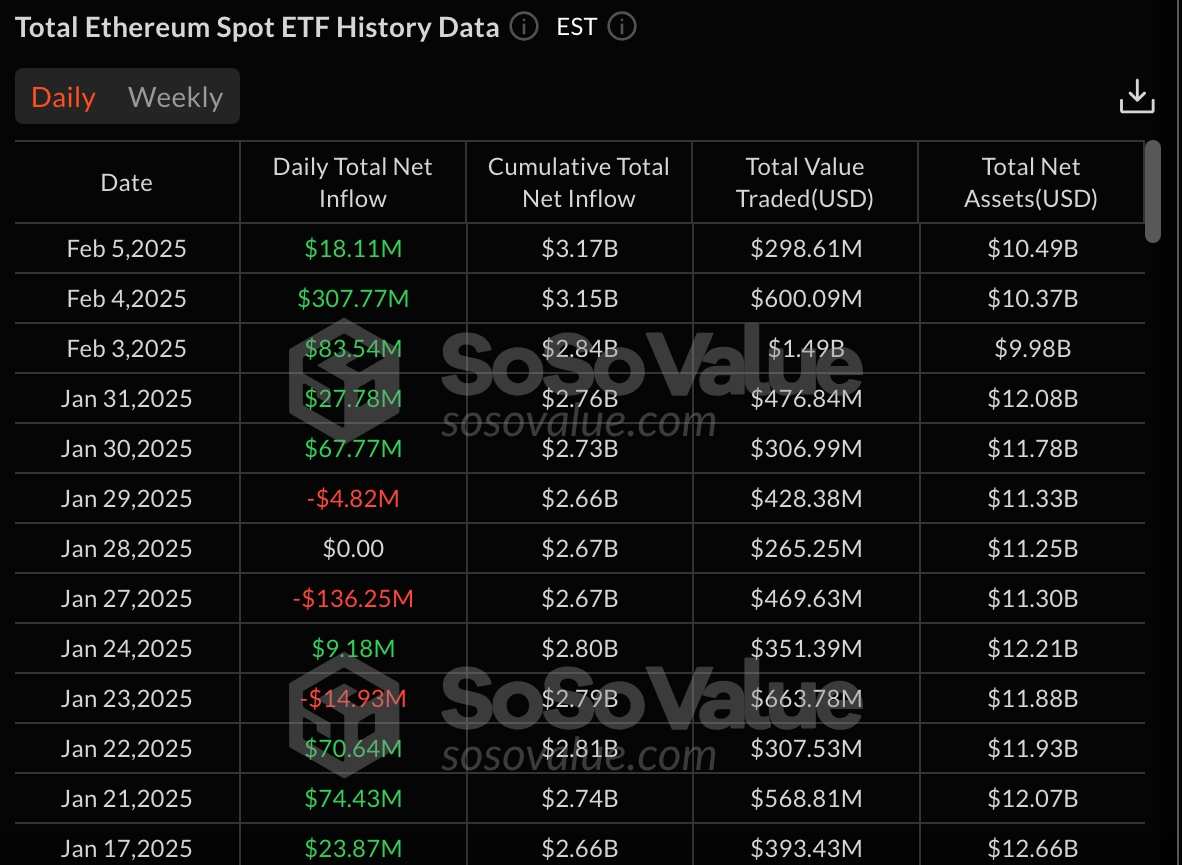
One potential catalyst for ETH is the ongoing spot Ethereum ETF inflows. SoSoValue data shows that these funds have had cumulative net inflows in the last six consecutive days, bringing the total flows to $3.17 billion.
That’s a sign that Wall Street investors are buying the dip, indicating more demand for these funds.
Still, spot Ethereum ETFs have a long way to go to catch up with Bitcoin (BTC), which accumulated over $40 billion in inflows.

Falling Ethereum balances on exchanges
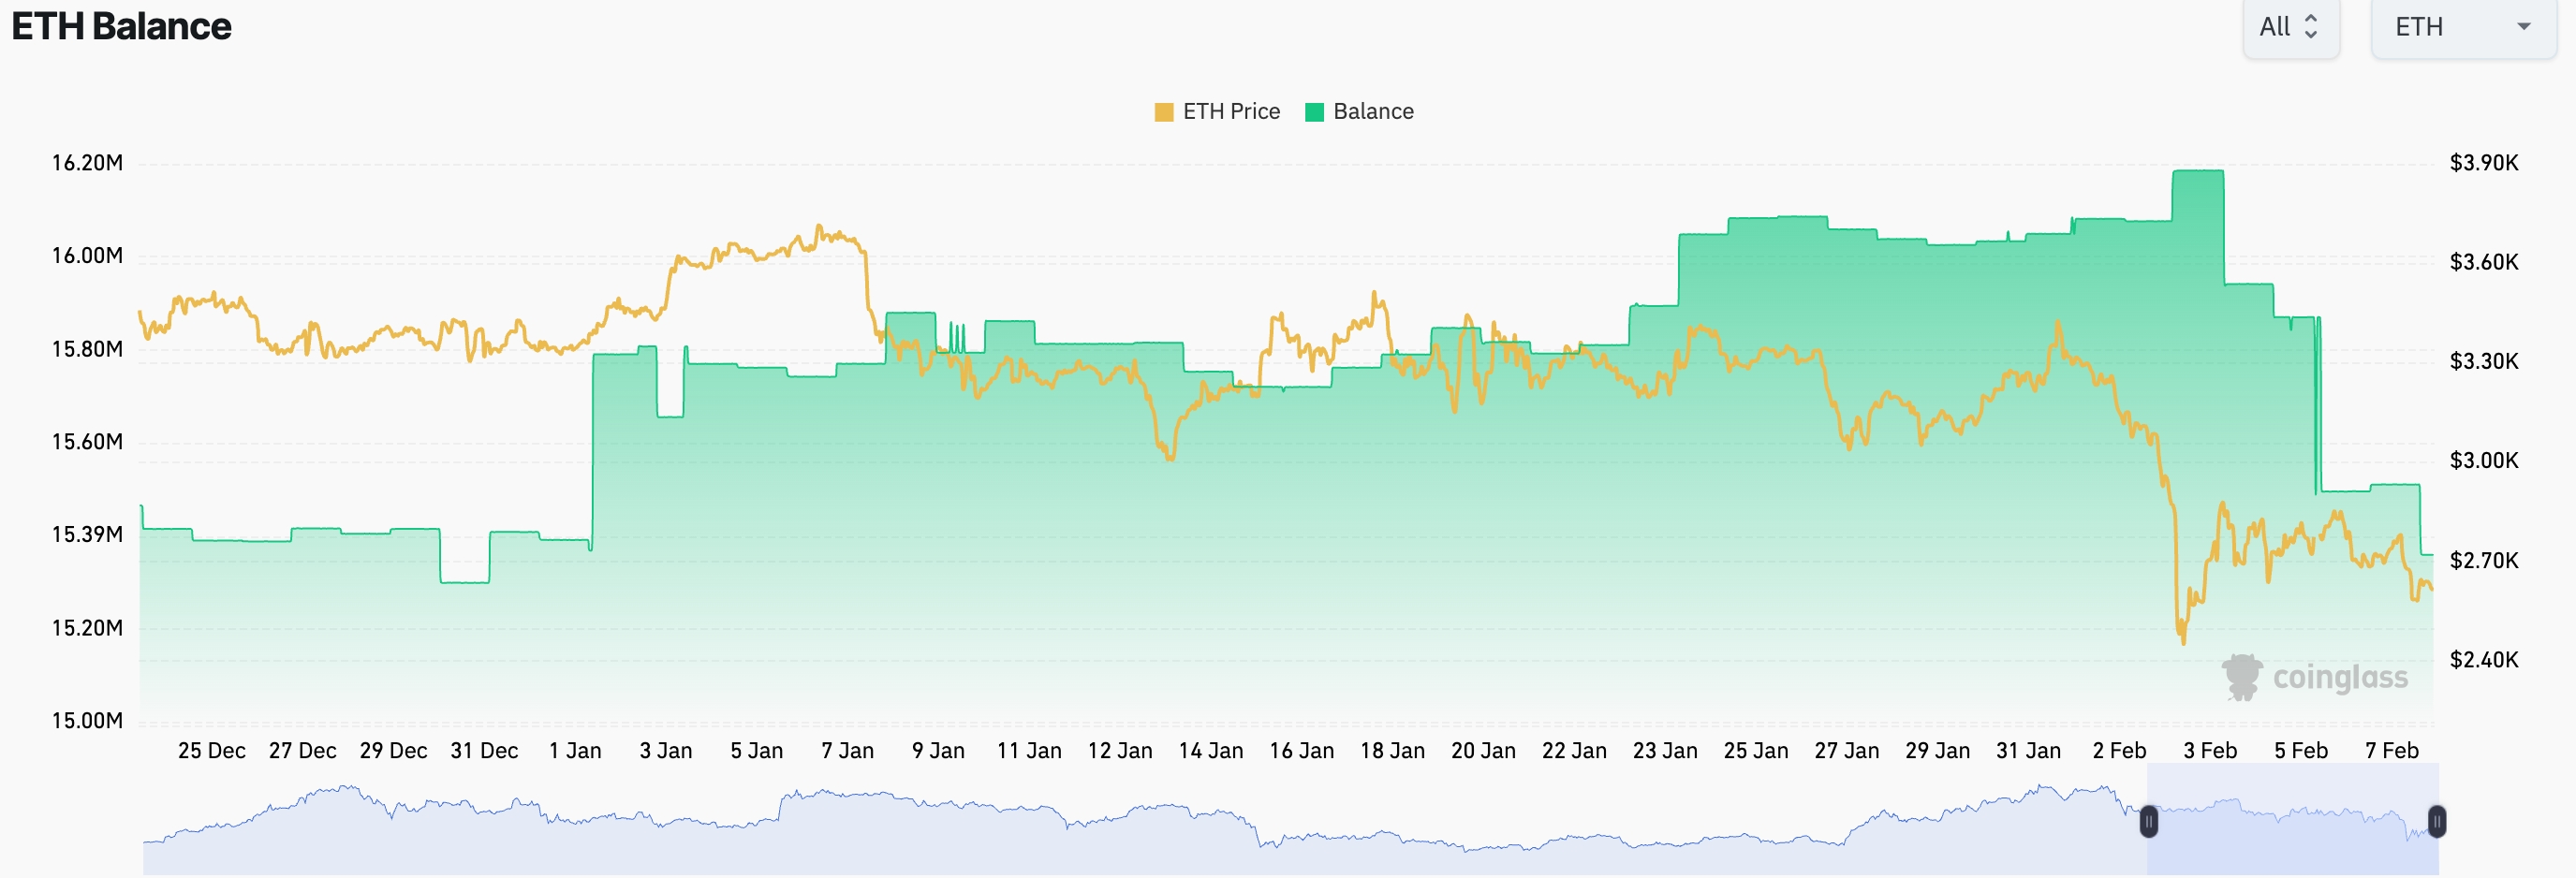
The other Ethereum price catalyst is the falling balances on exchanges, a sign of potential investor accumulation. ETH balances in exchanges tracked by CoinGlass have fallen to 15.36 million, down from 16.1 million earlier this year. They have fallen to the lowest level since December last year.
The falling Ethereum balances happen when activity in the over-the-counter, or OTC, sector is rises. OTC activity is common among large institutions that want to execute large transactions outside the public centralized and decentralized exchanges.

Ethereum price chart mirrors August’s bottom

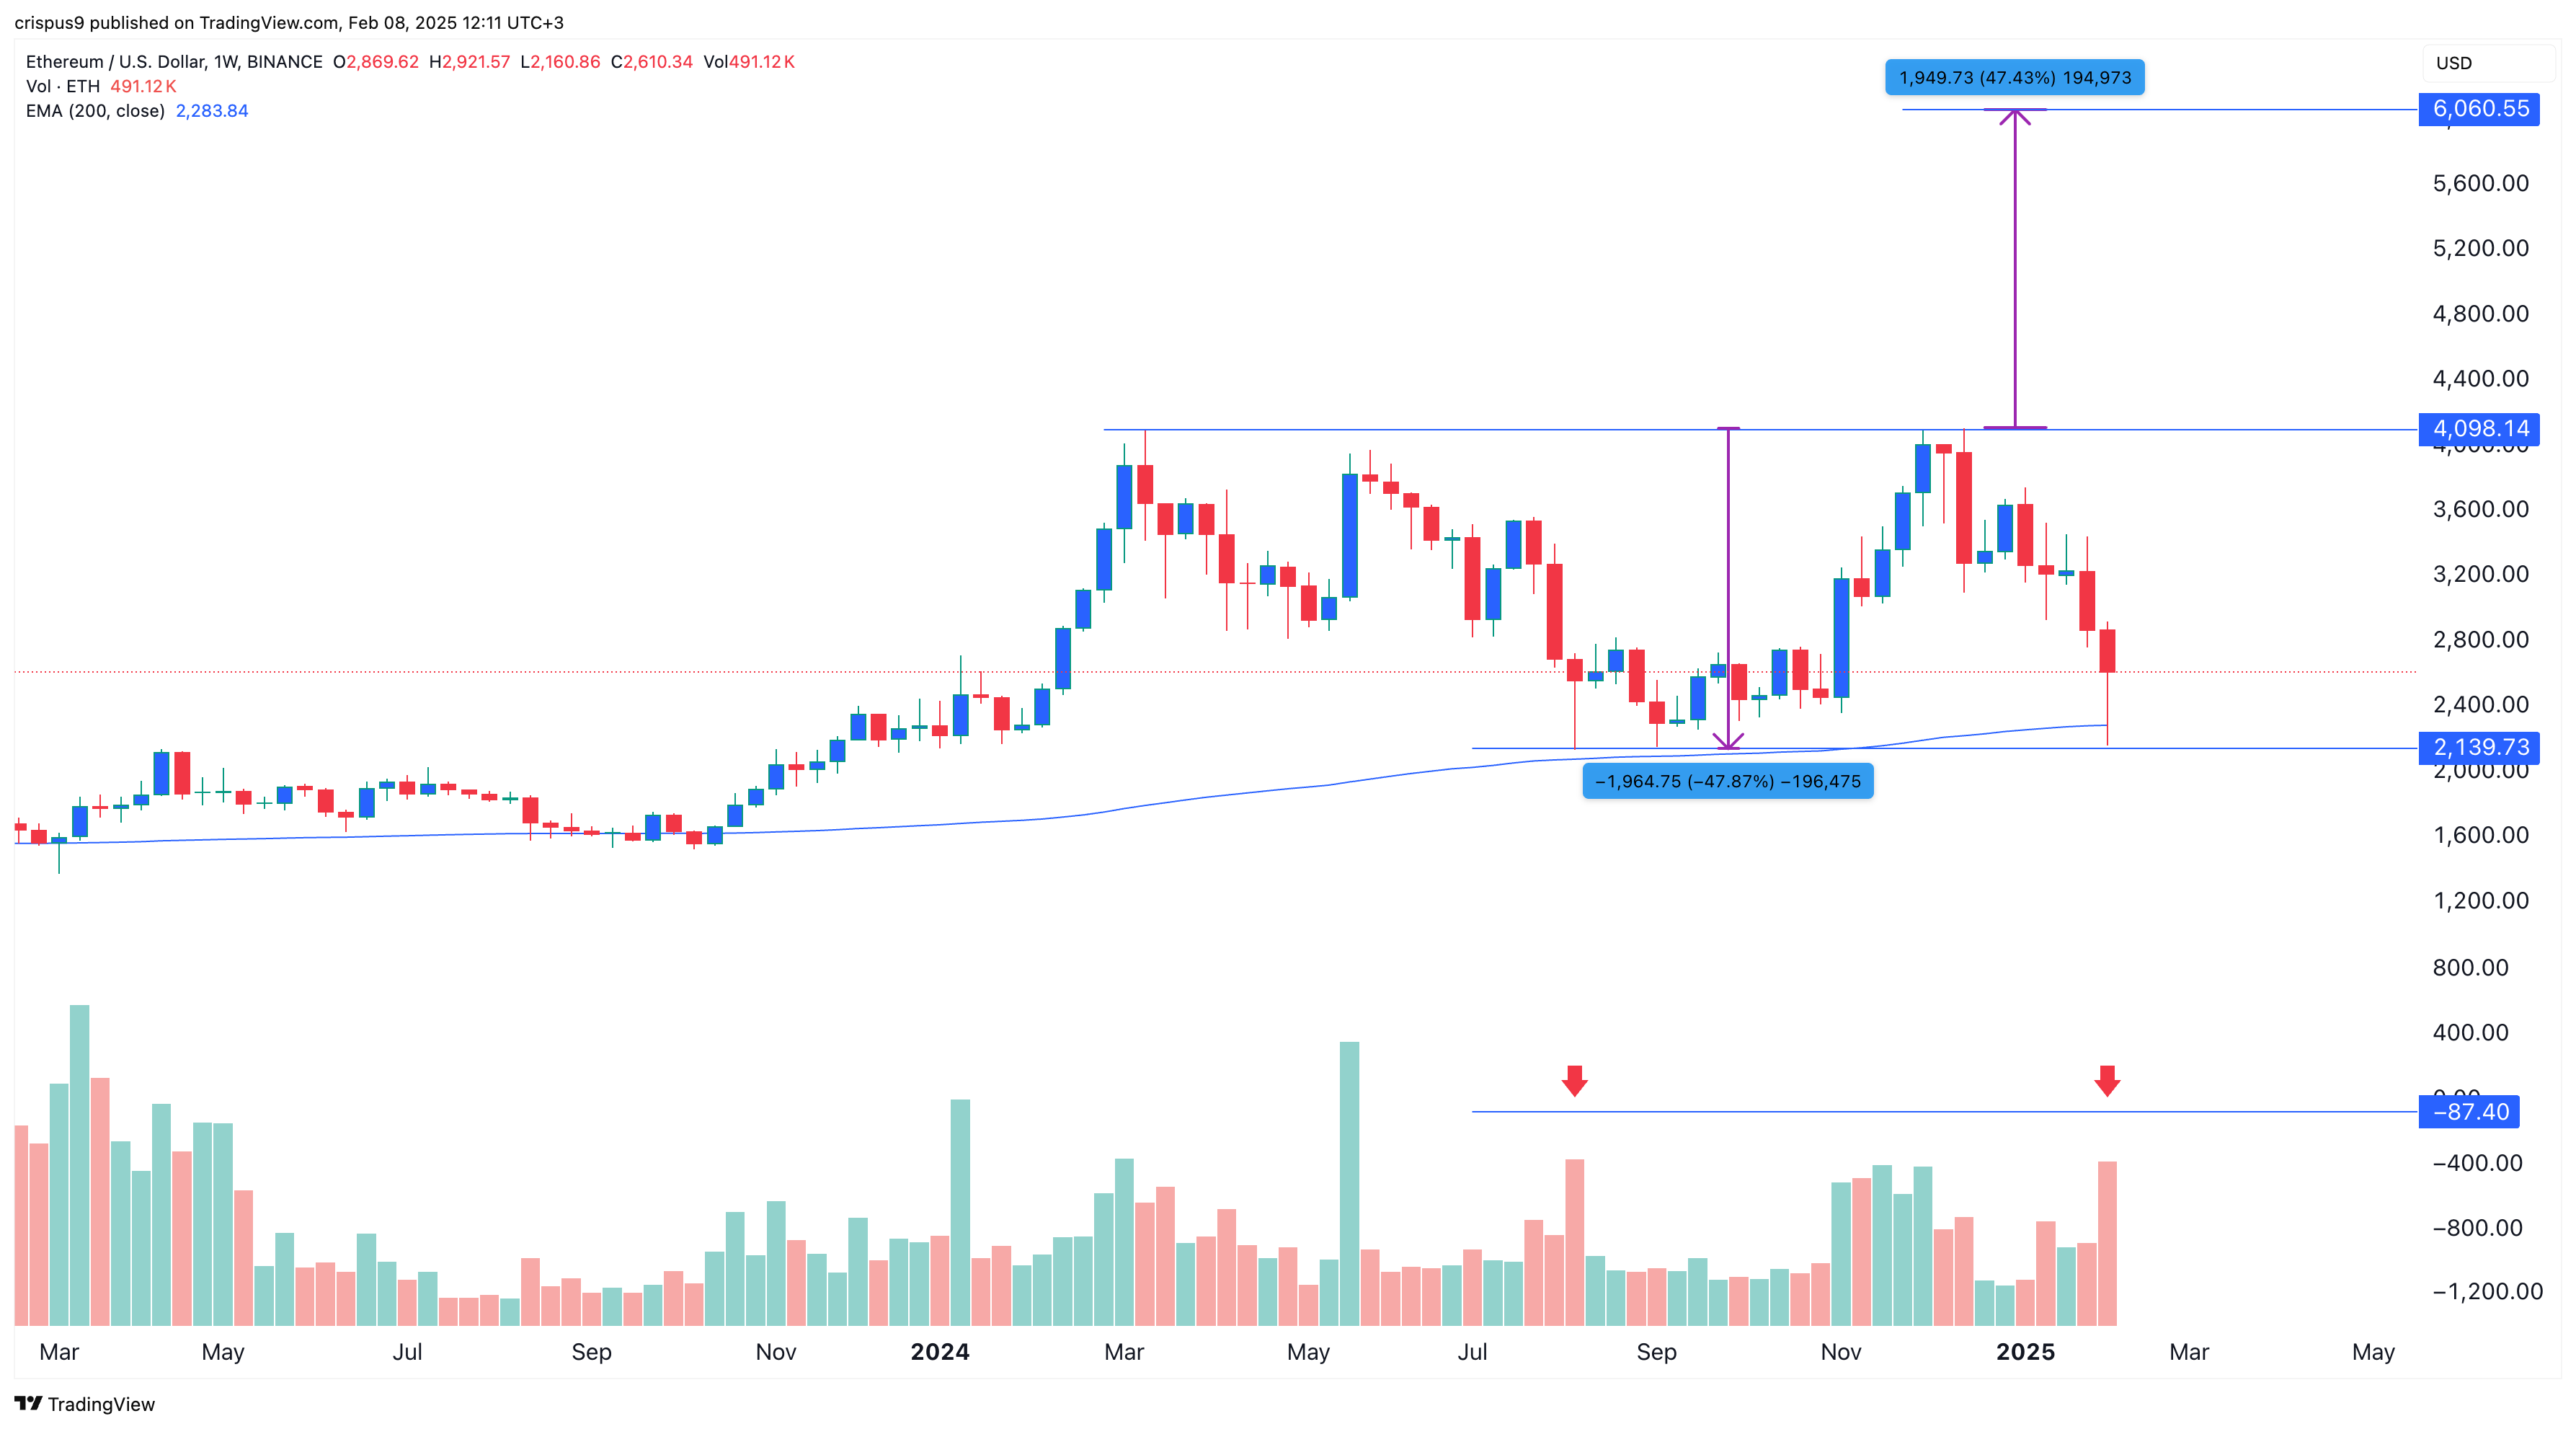
The weekly chart shows that the price of ETH crashed to a low of $2,140 this week. That’s its lowest level since August of last year. It has since formed a hammer pattern, which has a longer lower shadow and a small body and is a popular bullish reversal sign.
A similar pattern happened in August, when Ethereum bottomed at $2,139. The two big drops happened in periods of large bearish volume spikes. ETH also found support at the 200-week moving average.
Therefore, the coin will likely bounce back, and possibly retest the resistance at $4,080. A break above that level will point to more gains to the all-time high of $4,800, followed by $6,000.
Crypto Firms Push Into US Banking
America’s cryptocurrency companies are scrambling to secure a foothold in the country’s traditional banking system, ... Read more
Ether Surges 16% Amid Speculation Of US ETF Approval
New York, USA – Ether, the second-largest cryptocurrency by market capitalization, experienced a significant surge of ... Read more
BlackRock And The Institutional Embrace Of Bitcoin
BlackRock’s strategic shift towards becoming the world’s largest Bitcoin fund marks a pivotal moment in the financia... Read more
Robinhood Faces Regulatory Scrutiny: SEC Threatens Lawsuit Over Crypto Business
Robinhood, the prominent retail brokerage platform, finds itself in the regulatory spotlight as the Securities and Excha... Read more
Ethereum Price Holds Five-year Range As Breakdown Risk Points To $950
The current Ethereum price is within a long-term five-year range and positioned below key volume levels, increasing the ... Read more
400 Million Coins Left: BlockDAGs $0.0005 Entry Price Is About To Vanish Forever
BlockDAG is entering its final presale hours at a fixed price of $0.0005, with only 400 million coins remaining before p... Read more

